New issue
Have a question about this project? Sign up for a free GitHub account to open an issue and contact its maintainers and the community.
By clicking “Sign up for GitHub”, you agree to our terms of service and privacy statement. We’ll occasionally send you account related emails.
Already on GitHub? Sign in to your account
Pipeline to print inferred 3D bounding boxes on images #64
Comments
|
If you want to access "image" during test, you need to change the dataloader GDR-Net/core/gdrn_modeling/data_loader.py Line 368 in 5fb30c3
|
|
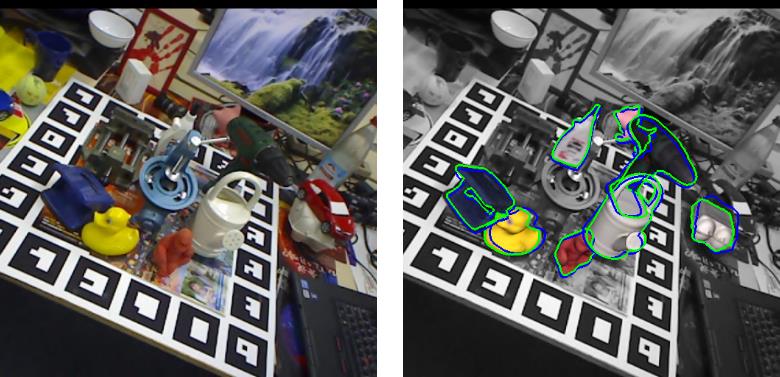
@wangg12 Your work is very meaningful. Can you tell me where the code for visualizing 6D pose is as shown in the figure below? |
Many thanks, actually by inspecting the code, I realized that I don't need the image to be inside the image field (I could load it directly from disk), I think I would just need the 8-vertex bounding box in pixel coordinates to be returned among the results datastructure that at the moment contain only rotation and translation |
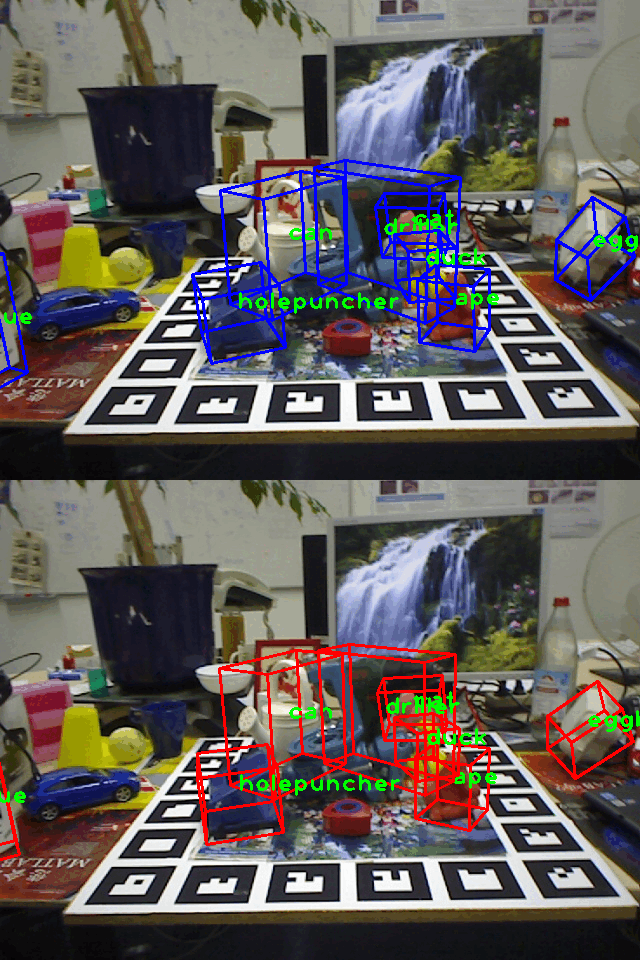
With the modifications in my fork AlbertoRemus@7dd7e92 you can see what I was looking for (blue ground truth, red prediction): Initially I hadn't realize that given:
It is straightforward to compute the 2D projection of the 3D model points on the image plane, if one just needs the 8-vertex bounding box it just needs to form all the 8 possible combinations from |
|
Provided the solution found in #64 (comment) I would close this issue (@wangg12 let me know if you need these modifications upstream I can open a PR) @Liuchongpei your question is interesting, it may be worth to open a separate issue for that to visualize that plot with the segmentation mask |
This quick and dirty modification should do the job: AlbertoRemus@38adf26 |
Hey, I can't find the branch you mentioned, does anything wrong? |
Hi, now the links should be fixed! |


Hello! I find this work really interesting. After successfully testing inference (LMO and YCB) I was just interested in plotting the inference results as 3D bounding boxes on RGB images and by inspecting the code I bumped into:
GDR-Net/core/gdrn_modeling/gdrn_evaluator.py
Line 516 in 5fb30c3
it is the function used for inference, which seems to show the results in terms of the different metrics, but not showing graphical results as I am looking for
In the same file I noticed the function:
GDR-Net/core/gdrn_modeling/gdrn_evaluator.py
Line 634 in 5fb30c3
which seems structurally similar but with some input differences, in particular I would like to ask if the input dataloader can be be computed for
gdrn_inference_on_datasetas forsave_result_of_datasetas inGDR-Net/core/gdrn_modeling/engine.py
Lines 135 to 137 in 5fb30c3
Since from preliminar debugging it seems it is not possible to access to the
"image"field of the input sample inGDR-Net/core/gdrn_modeling/gdrn_evaluator.py
Line 678 in 5fb30c3
Possibly related issue: #56
The text was updated successfully, but these errors were encountered: