This repo provides explorations and examples of using subgrounds to build dashboards and data analytics web apps.
Subgrounds is a framework for querying, manipulating and visualizing data indexed on The Graph network.
Subgrounds is still in the very early stages of development. APIs can and will change (now is the time to make suggestions!). Some features are still incomplete. Documentation is sparse (but getting better). Expect the Subgrounds API to change frequently.
IMPORTANT: Subgrounds requires Python version 3.10 or higher
Subgrounds is available on PyPi. To install it, run the following:
pip install subgrounds.
Subgrounds uses DASH for visualization, and will install Dash for you. However, if needed, run the following
pip install dash
If you prefer Jupyter notebook or JupyterLab as your development environment, installing jupyter-dash by running the
the following
pip install jupyter-dash
A lot of examples utilize the dash bootstrap component. Please install dash bootstrap using the following
pip install dash-bootstrap-components
Subgrounds provides wrappers for Plotly objects and Dash components to facilitate visualization of data from The Graph.
Plotly wrappers can be found in the subgrounds.plotly_wrappers submodule. The wrappers include a Figure wrapper as well as wrappers for most Plotly traces (see https://plotly.com/python/reference/). All Plotly trace wrappers accept the same arguments as their underlying Plotly trace with the notable difference being that Subgrounds FieldPath objects can be used as arguments wherever one would usually provide data to the traces.
from subgrounds.plotly_wrappers import Bar, Figure
from subgrounds.dash_wrappers import Graph
borrows = aaveV2.Query.borrows(
orderBy=aaveV2.Borrow.timestamp,
orderDirection='desc',
first=100
)
repays = aaveV2.Query.repays(
orderBy=aaveV2.Repay.timestamp,
orderDirection='desc',
first=100
)
# Dashboard
app = dash.Dash(__name__)
app.layout = html.Div(
html.Div([
html.H4('Entities'),
html.Div([
# Subgrounds Graph Dash component
Graph(
# A Subgrounds Plotly figure
Figure(
subgrounds=sg,
traces=[
# Subgrounds Plotly traces
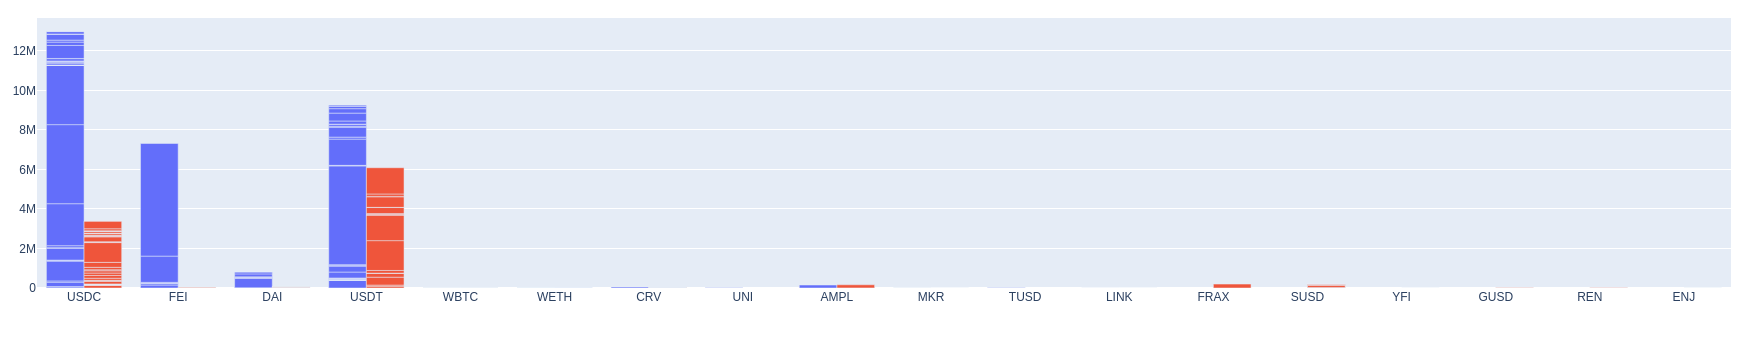
Bar(x=borrows.reserve.symbol, y=borrows.amount),
Bar(x=repays.reserve.symbol, y=repays.amount)
]
)
)
])
])
)Generates the following Dash dashboard (at time of writing):