Analysis and practice of what was taught in day 10 of NG30daysoflearning
The project seeks to identify:
a)Total sales and profit
b)Top and bottom 5 cities by sales and profit
c)Trend of sales and profit over the years and month
d)Ship mode with the highest profit and sales
Data was provided for us and can be gotten from https://aka.ms/30DLDATGitHubRepo
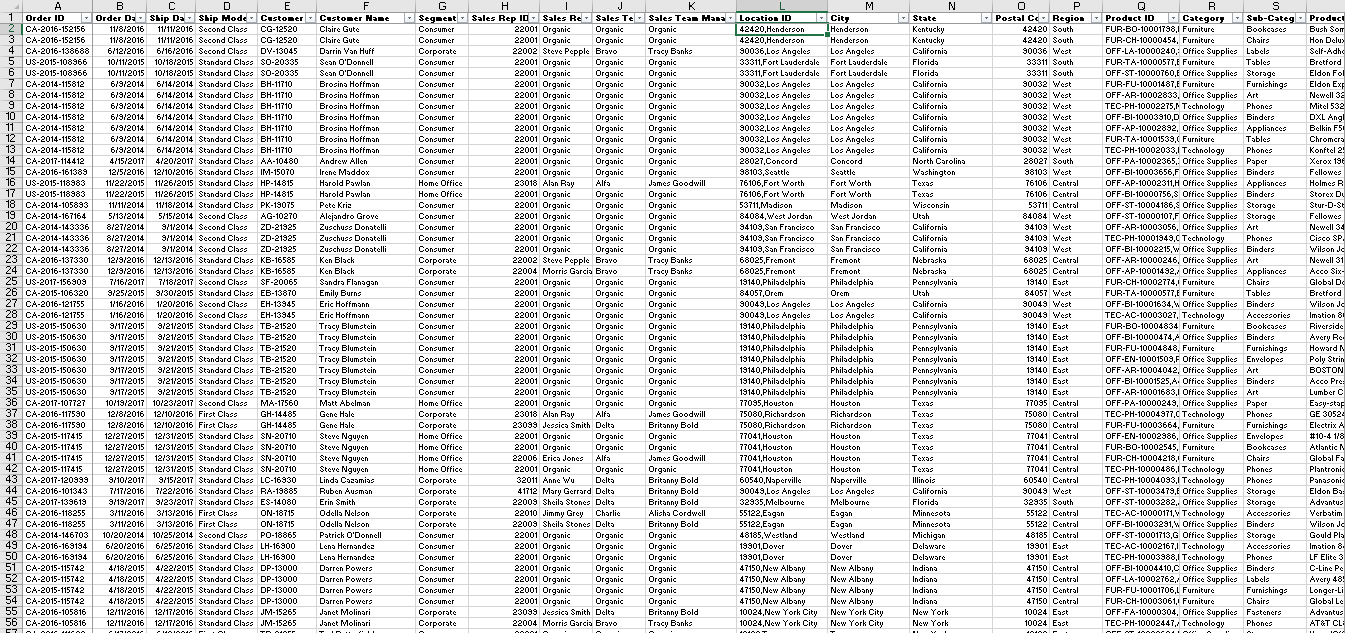
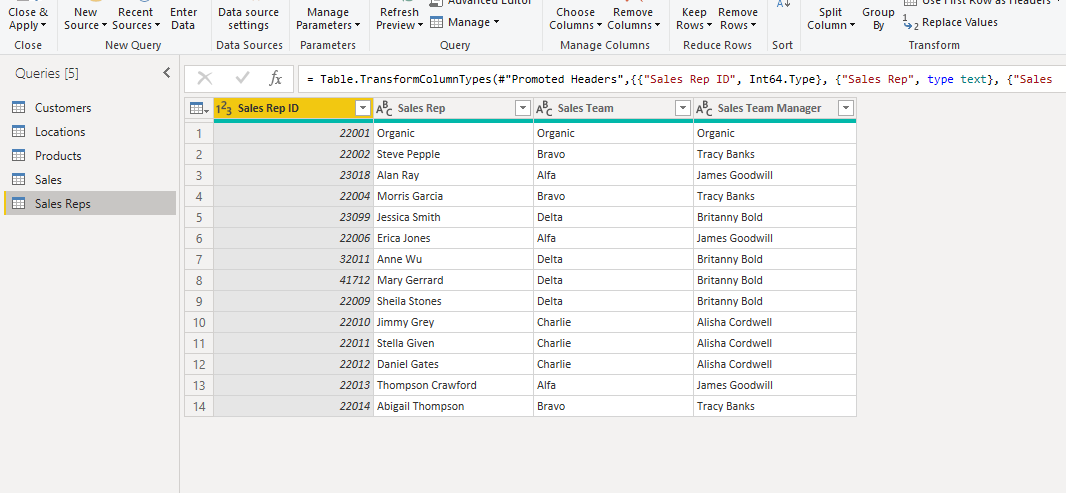
Two set of data was provided, a Denormalised(dirty) and Normalised(clean) dataset. I used the denormalised data set to work on this project. I opened it in excel file and i broke the information down into permanent and continous data. After which i removed unecessary columns, made sure my data type was correct.
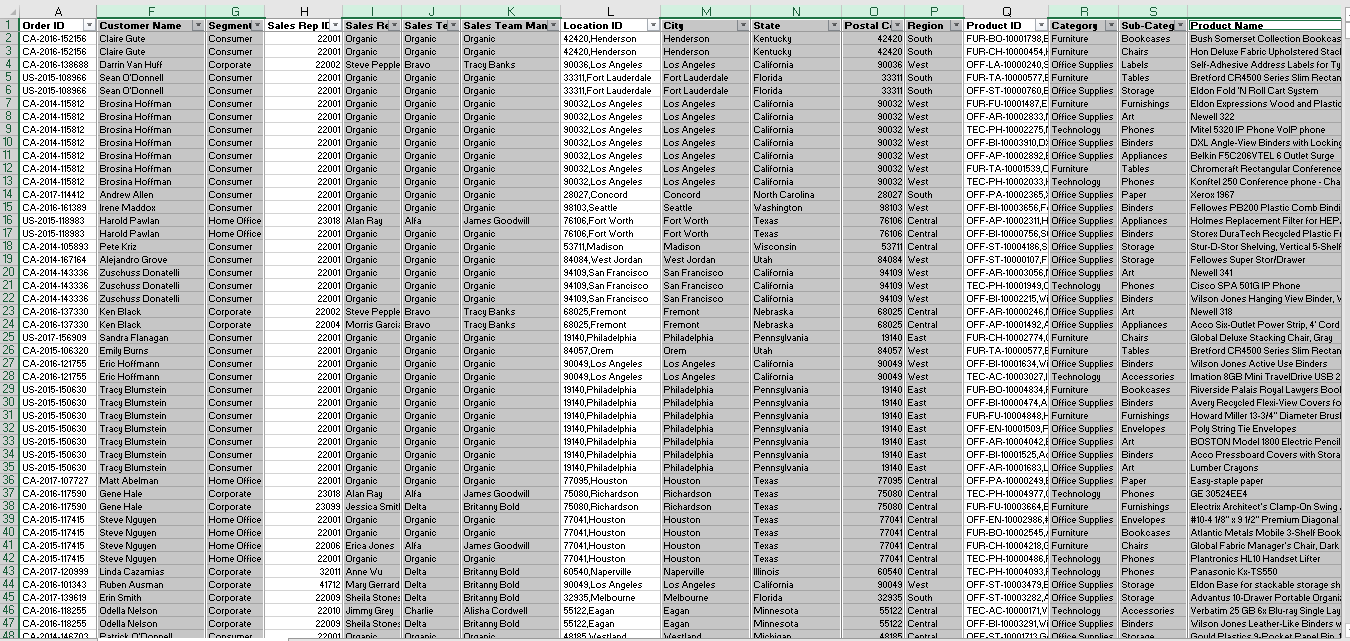 I then got a clean data (normalised) dataset
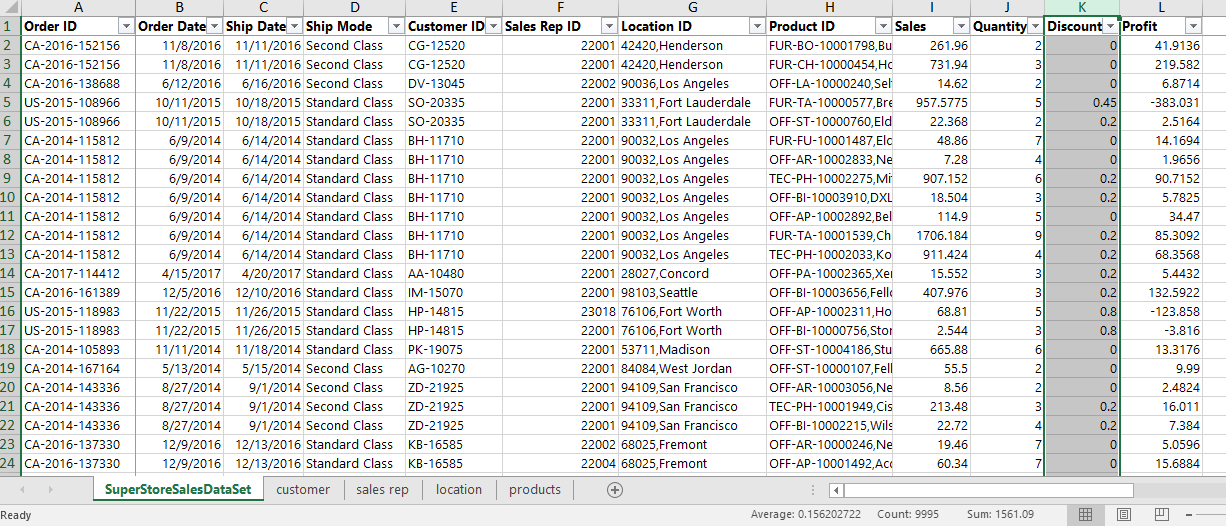
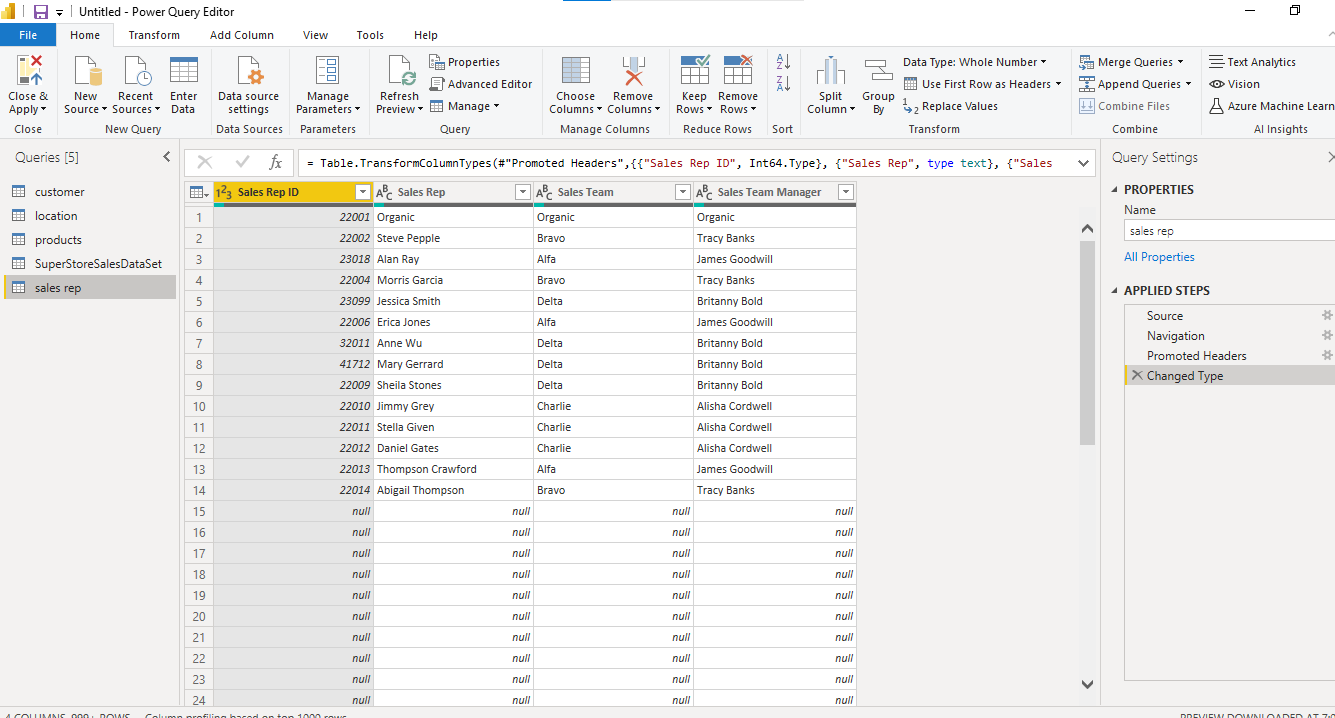
Then i saved and i uploaded my data into power bi, where i also carried out necessary transformation by removing blank rows via Power Qwery Editor.
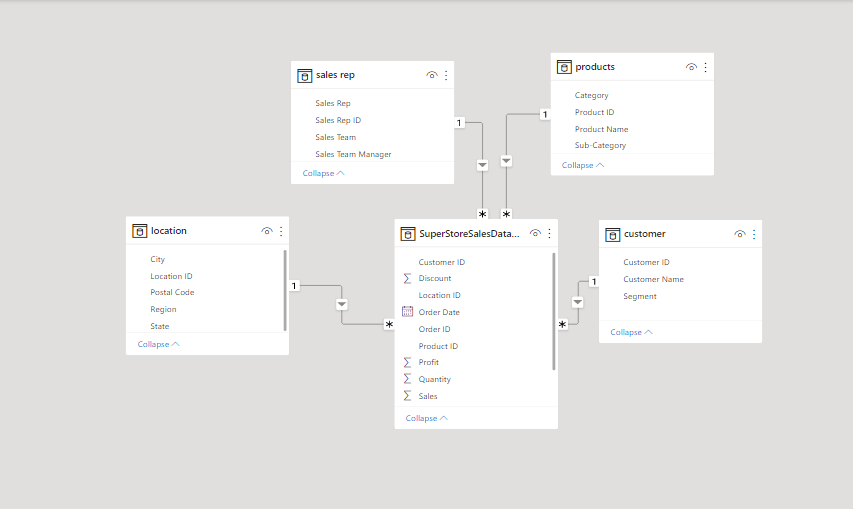
I also made sure my data had a good relationship and it was well modelled
I created a slicer containing; Months, Years, Region, and customers segment which can be applied to the visuals on the board.
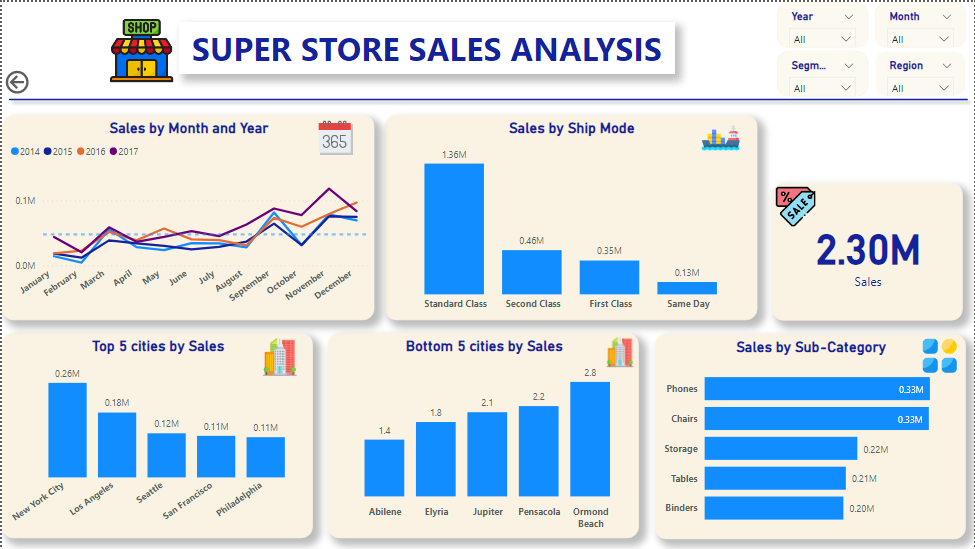
From 2014 till 2017 the total sales was 2.30 Million
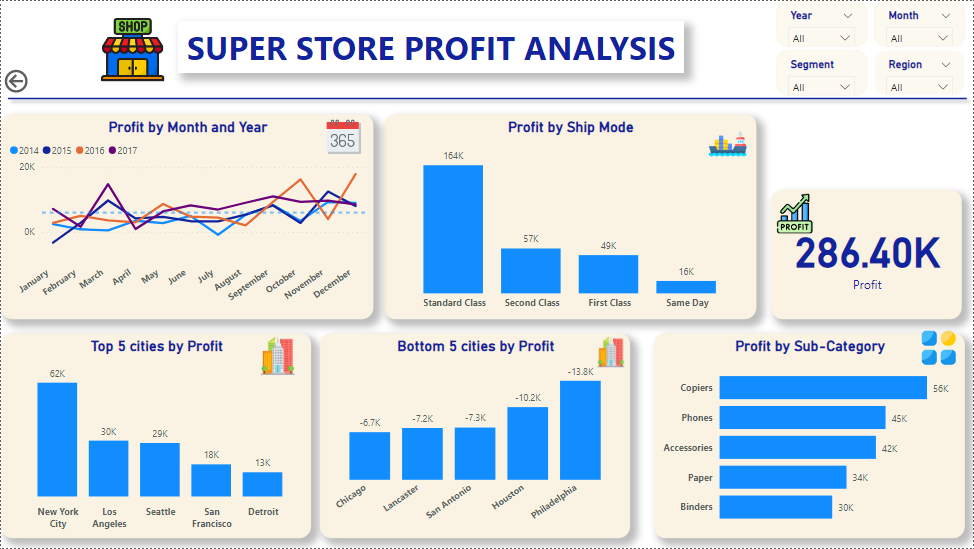
 and profit was 286.40K
November 2017 was the period with the highest sales 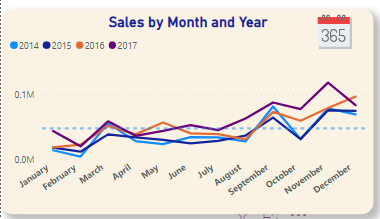
and December 2016 was the period with the highest profit 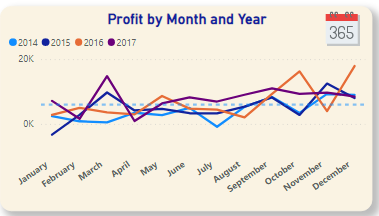
Based on sales, Newyork was the city with the highest sales and Abilene was the city with the lowest sales 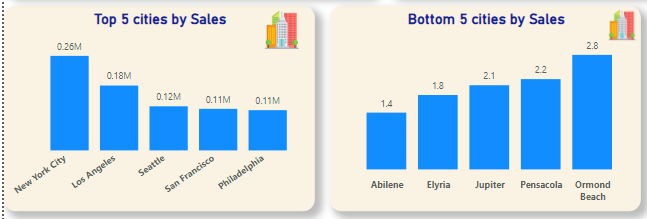
Based on profit, Newyork had the highest and Philadelphia had the lowest 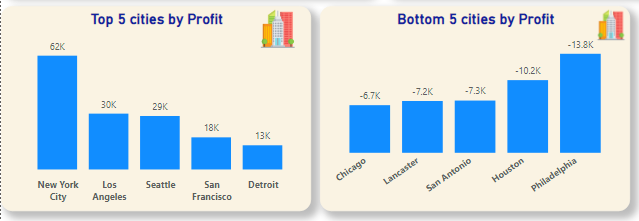
More resources should be put into the stores at New York cos of its high profit margin compared to other cities
The stores at Philadelphia and the remaining bottom 4 should be closed down and the resources should be distributed to other striving stores, alos the reason for the low profit should be investigated