This is a project to show what I learnt in Day 15 and 16 of the NG30daysoflearning. "Storytelling with PowerBi by Paul"
TheOyinbooke and friends decided to set up a training NG30daysoflearning for the Nigerian University students affected by the ongoing ASUU strike. Their goal was to equip the students with the necessary skills, needed to kickstart a carrer in the Data world.
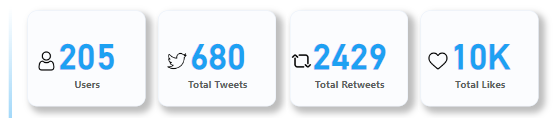
Few days ago I received a mail from one of the organisers, in which I was told to analyse the twitter engagement of the programme and draw out necessary insights that can be used to answer the big question Was this programme a Success
Dataset was provided in two forms, of which any can be used
Data was extracted from the web into PowerBi
Data was cleaned in PowerQwery
- A column that contained both date and time from the raw data was split into two seperate columns
- The date column was transformed to get Day name which was then sorted by day number
- The time column was transformed to get the hours
- Datatypes were validated and every other details was checked accordingly
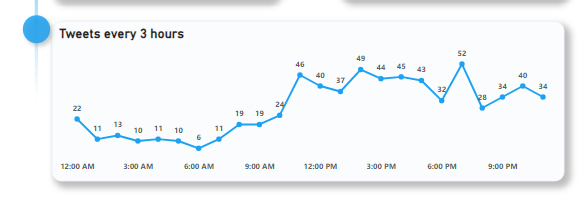
- 7pm had the most activity with 52 tweets followed by 12pm at 49 and 11am at 46. This begs the question, Why was activities higher at this time,could it be that's the time most people get back from work and are settled to start their lessons?. A futher dive into this can help organisers make decisions as to what's the best time to have classes and many more.
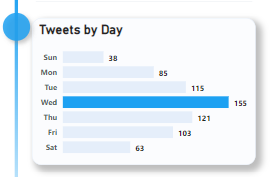
- Wednesday topped the list with 155 . One will wonder if something special happens on this day, or if the organisers do something on this day that should be taken note of. Our dataset can't answer this questions but a survey carried out by the organisers can help answer it.
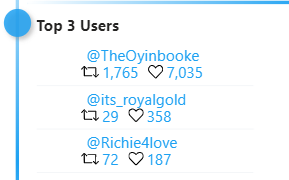
- Out of the Top 3 active participants 2 are acutual learners, this is an excellent insight as it shows the training is effective,
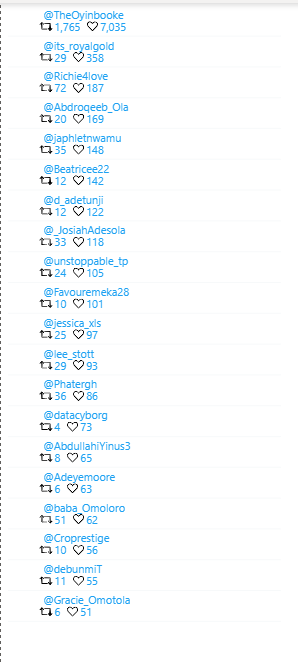
- A futher research into this category showed that out of Top 20 participants, about 15 are actual learners, we can say, the participants are involved in their learning and showcasing their work
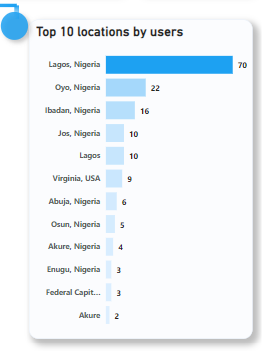
- In case of a data hangout or creation of a physical Hub, Lagos will be the go to location, most of the participants are located here.
- Also USA can be seen on the chart, showing the training went beyond the shores of Nigeria.
In the dataset location had 71% validity, blank spaces and Nigeria was excluded so as to get a rough visualisation of this category
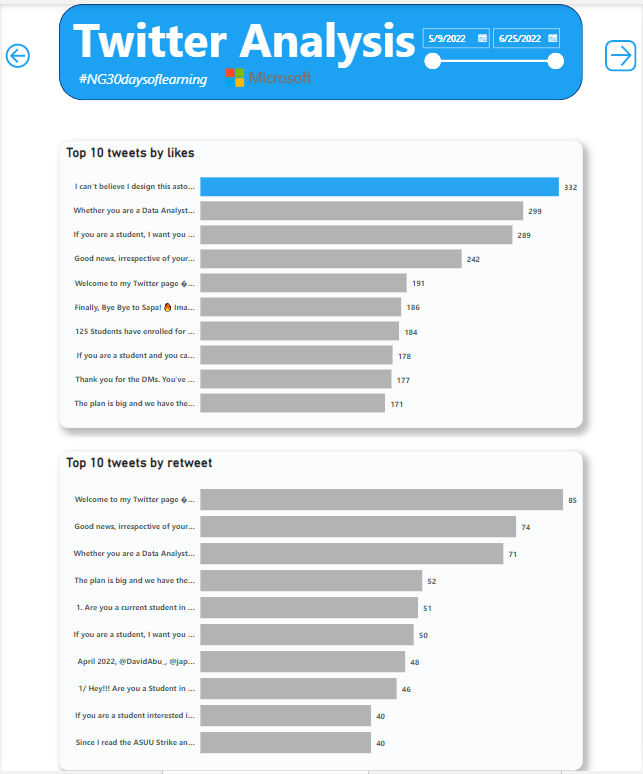
- A pattern can be seen from this category, in the most liked tweets, 9 are announcements except the first tweet which was by a participant and for the most retweeted all 10 are announcements.
- Organisers should carry out a survey to get clearer insights why Wednesday and 7pm are topping their various categories, this can be used to make more informed decisions about what time to hold classes and time they can get most of the attention of the participants
- Ways should be crated to showcase the actual participants posts and work to a larger audience, this will give room for more opportunities for them and collaborations with other Data Training Organisation
- Posts of the actual learners should have higher likes and retweets as this will help people know the participants are actually learning. An avenue should be created to help the learners showcasing their work reach a higher audience