This is a project to visualize the regular pattern of email response behavior of an email user and his/her contacts.
Using a provided dataset which contains the email information of a user and his/her contacts, we want to figure out the regular pattern of email response behavior between email users and their contacts.
Video: https://vimeo.com/196884388
There are three primary problems we want solve from the data.
-
What is the relationship between response time and who is the specific contact (One may often respond a close friend or the boss faster, but respond a stranger slower). That might indicate who are the contacts that an email user close to and who are not.
-
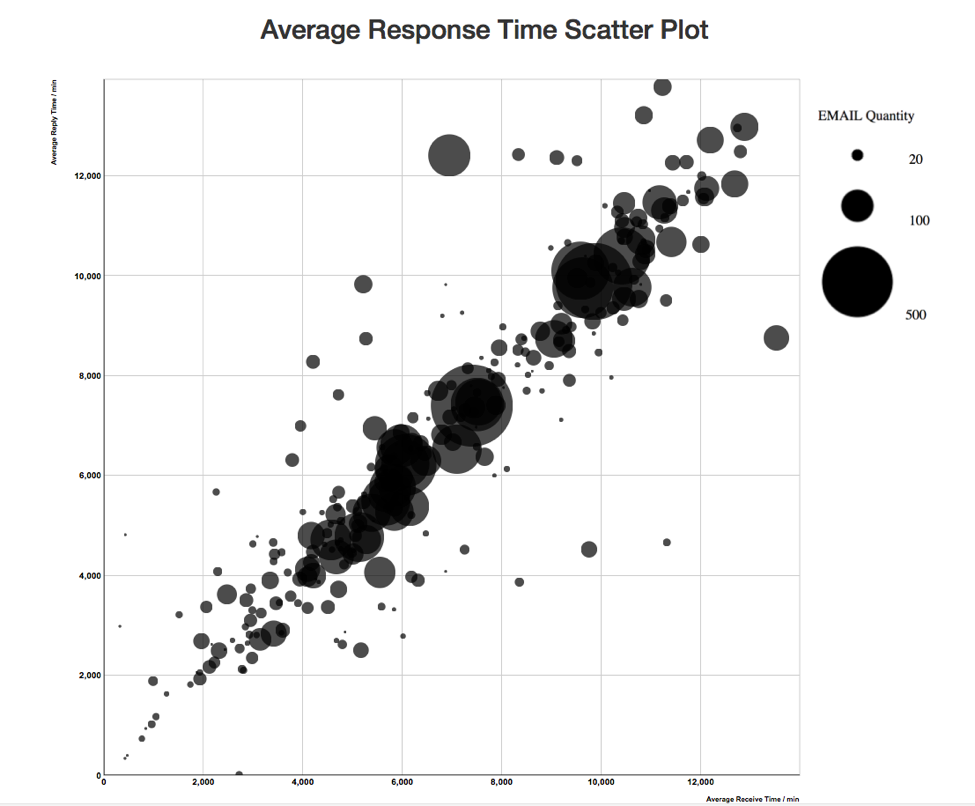
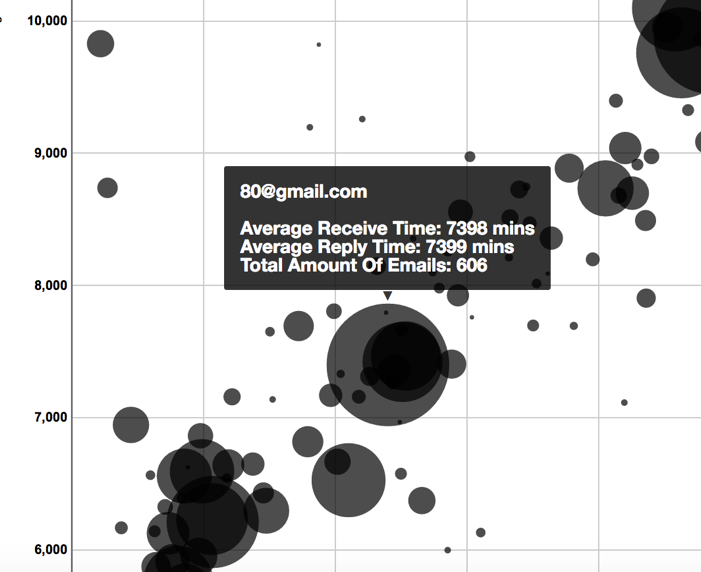
What is the relationship between average receiving time from and replying time to a specific contact? And how the response time looks like when comparing with each other?
-
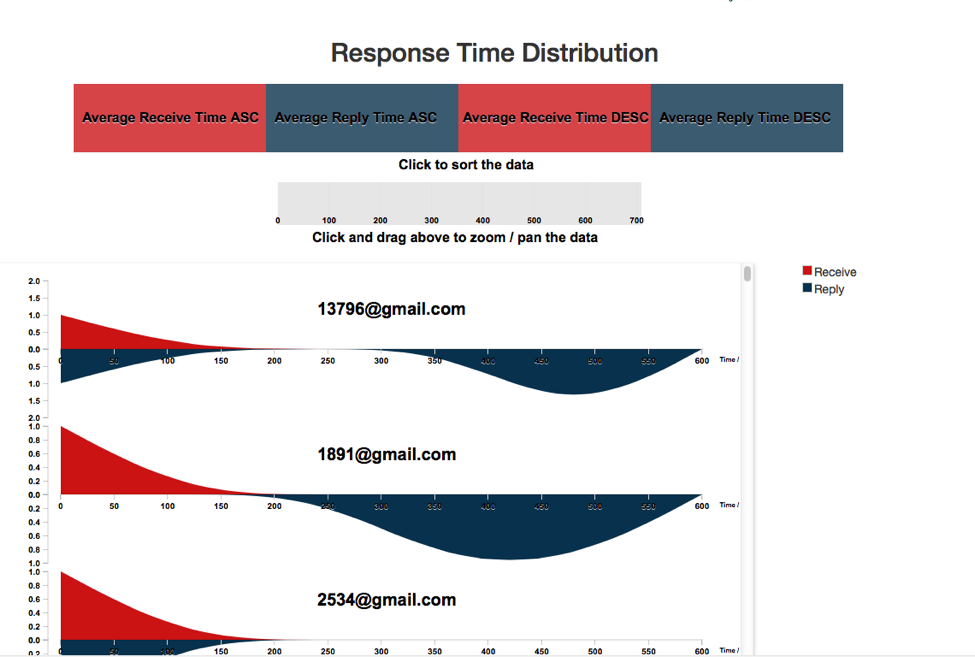
How does the quantity of email between an email user and his contacts distribute over response time? (For a specific contact A, one could reply 3 emails in 5 minutes, 2 emails between 5 and 10 minutes, 4 emails between 10 and 15 minutes…)
d3.js, javascript, JQuery, css, html
homepage.html : main page of our project
css/style.css : css file
js/main.js : use d3.js to draw charts in our page
data : the datasets we use to visualize