HCIplot -- High-contrast Imaging Plotting library. The goal of this
library is to be the "Swiss army" solution for plotting and visualizing
multi-dimensional high-contrast imaging datacubes on JupyterLab.
While visualizing FITS files is straightforward with SaoImage DS9 or any
other FITS viewer, exploring the content of an HCI datacube as an
in-memory numpy array (for example when running your Jupyter
session on a remote machine) is far from easy.
HCIplot contains two functions, plot_frames and plot_cubes,
and relies on the matplotlib and HoloViews libraries and
ImageMagick. HCIplot allows to:
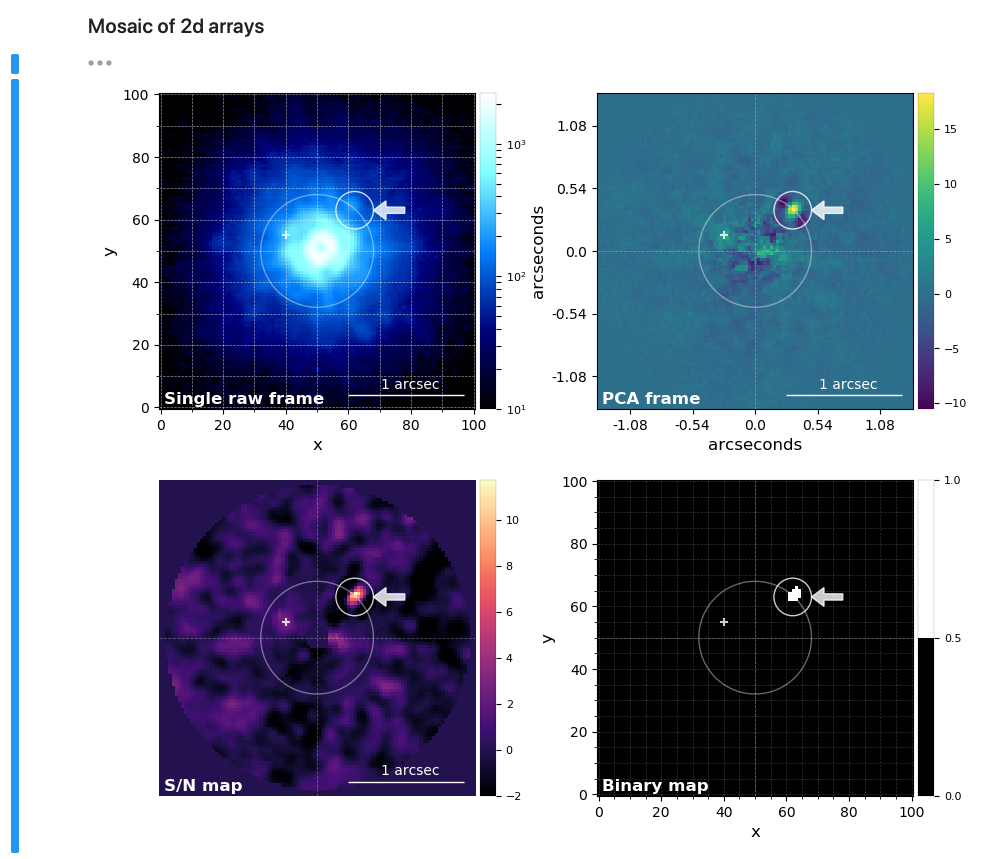
- Plot a single frame (2d array) or create a mosaic of frames.
-
Annotate and save publication ready frames/mosaics.
-
Visualize 2d arrays as surface plots.
-
Create interactive plots when handling 3d or 4d arrays (thanks to
HoloViews)

- Save to disk a 3d array as an animation (gif or mp4).
You can install HCIplot with pip:
pip install hciplot
JupyterLab can be installed either with pip or with conda:
conda install -c conda-forge jupyterlab
The PyViz extension must be installed to display the holoviews
widgets on JupyterLab:
jupyter labextension install @pyviz/jupyterlab_pyviz
If you want to create animations with plot_cubes you need to install
ImageMagick with your system's package manager (e.g. brew if you are
on MacOS or apt-get if you are on Ubuntu).