VMAgent dropping target on high load #582
Comments
|
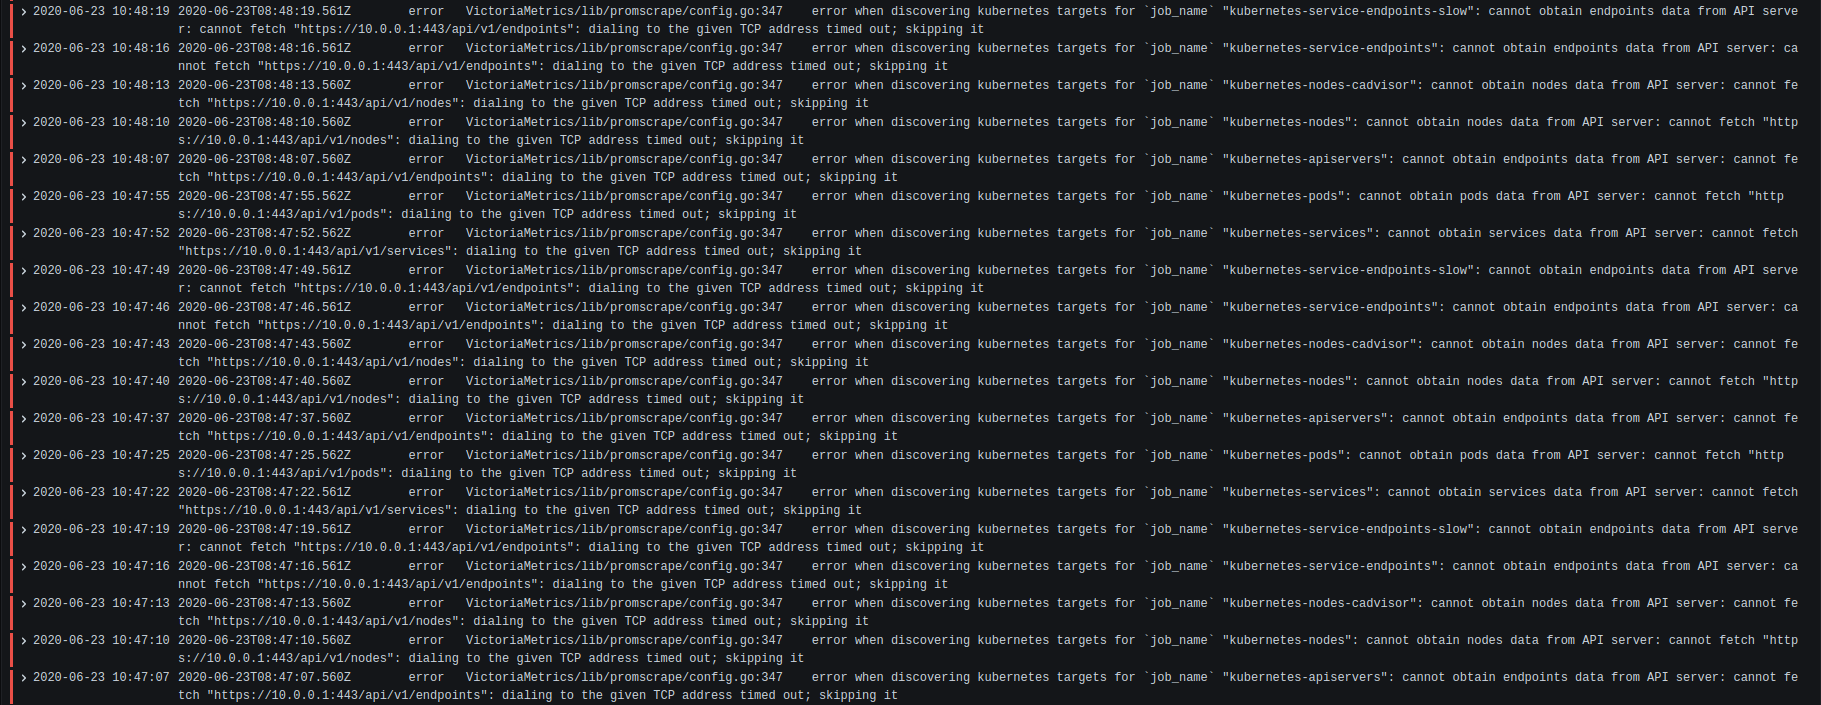
The first screenshot with error logs show that K8S API server had some issues. It couldn't dial certain K8S nodes via
These errors suggest that there were networking issues in K8S during this time frame.
This looks like a bug in |
That's why it's strange, I don't recall having those error with prometheus, and no gap in graph either
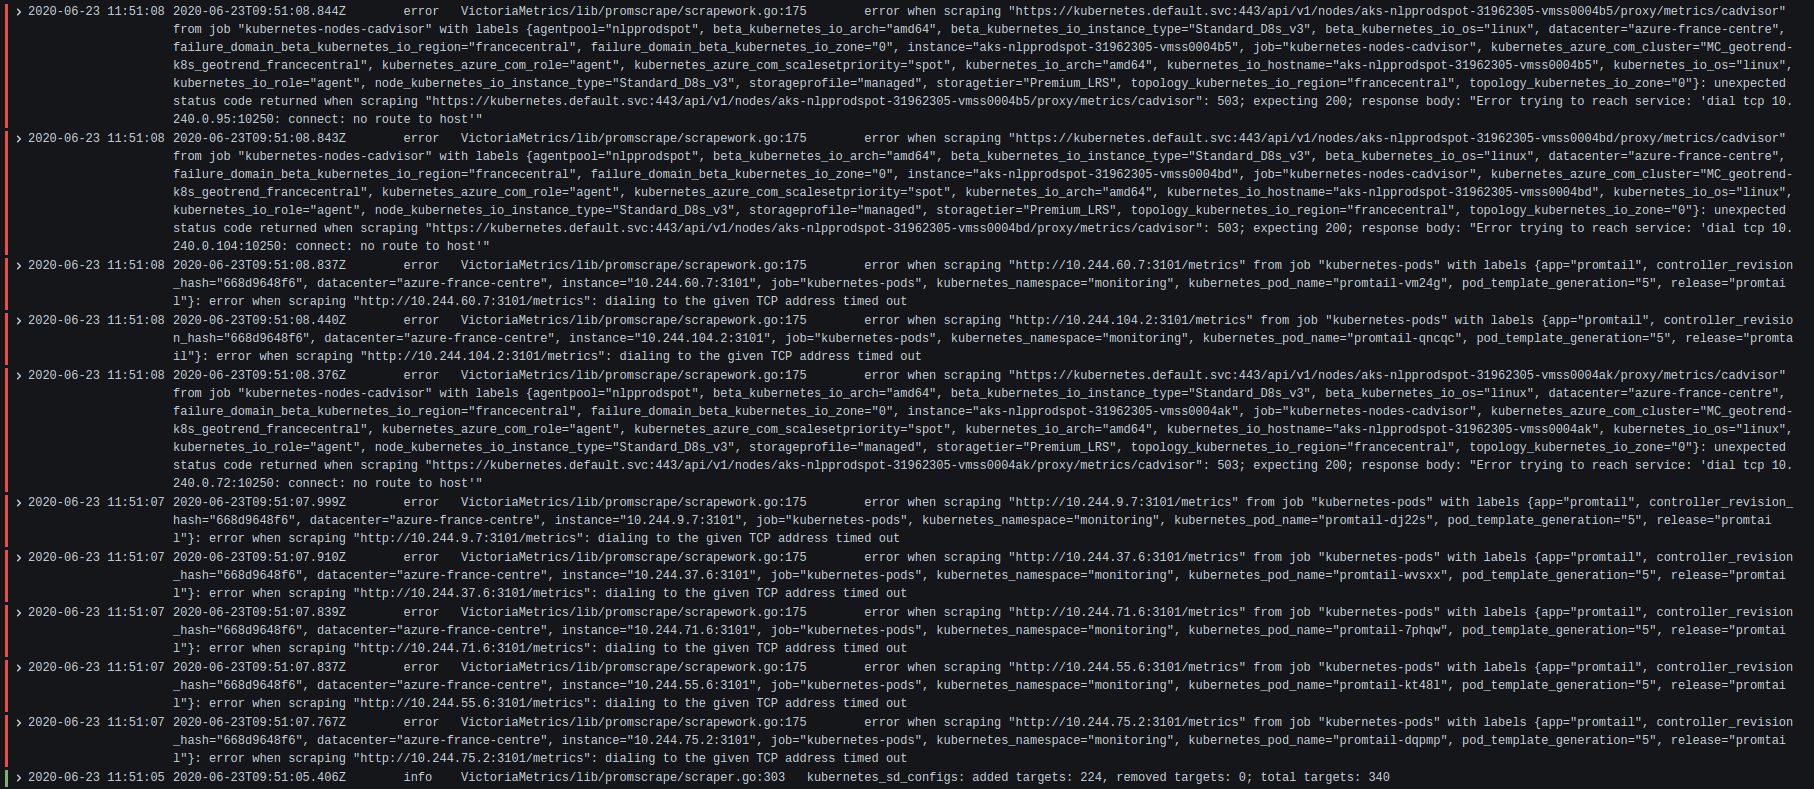
There is more log like the first screenshot, but I also found this, should be linked to target drop: |
Prometheus doesn't log scrape errors. The last error per each target can be seen at As for gaps, they may be related to the bug with targets' drop in
Thanks for these screenshots! They show the real cause of the issue with dropped targets - when |
Oh, that's good to know for prometheus, thanks
Happy to help :) |
…ry errors per each `job_name`

Updates #582
|
@AzSiAz , the fix is available in the commit 8f0bcec . Could you build
Both Prometheus and vmagent record |
Thanks I will try with this commit and come back, hopefully with good news
Well, I did not think of that one, I will use it to check uptime with new version |
|
There is still a lot of scraping error, but it's not dropping target anymore with your latest fix, thanks :)
|
…ry errors per each `job_name`

Updates #582
|
Well, after regularly forcing scaling for 2 days, I am happy to say this problem did not happend again, so all is now good, issue can be closed on next VMAgent version 😄 |
|
@AzSiAz , thanks for the update! |
|
The bugfix has been included in v1.37.3. Closing the issue as fixed. |
Describe the bug
When there is a large number of target to scrape from, VMAgent have error on scraping, seem to happen only on large number of node/pods (cf last screenshot) before dropping all scraping target
Expected behavior
Should scrape target, like prometheus
Screenshots

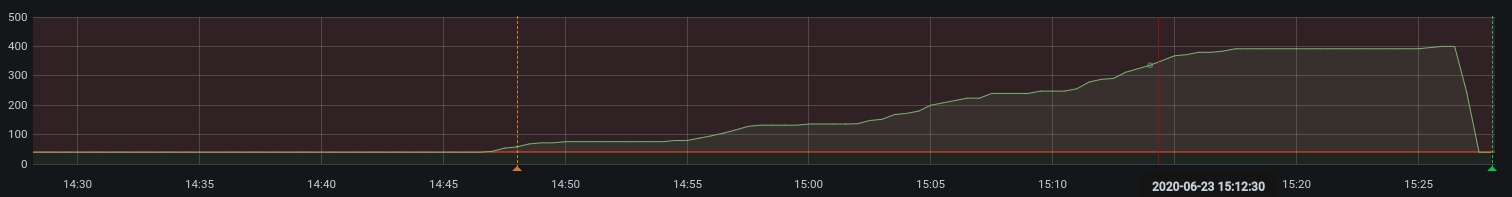
Sometimes VMAgent also remove all scraping target:
Last 1h (number of pods)
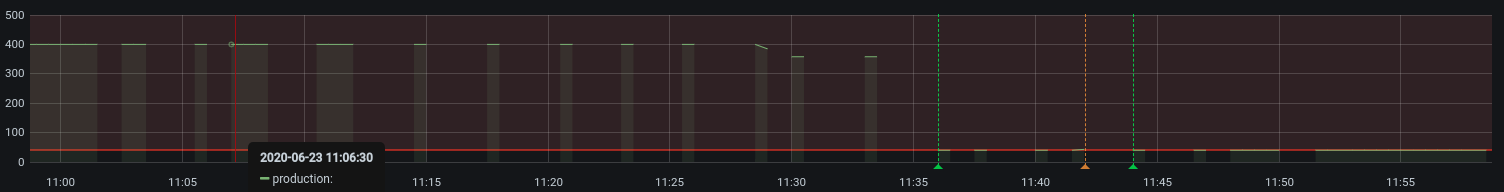

Last 12h (number of pods)
Version
The one from your helm chart VMAgent:
appVersion: v1.37.2Used command-line flags
The one from your VMAgent helm chart and 3 customs:
remoteWrite.maxBlockSize: "1000000"remoteWrite.basicAuth.usernameremoteWrite.basicAuth.passwordAdditional context
K8s is Azure AKS
The text was updated successfully, but these errors were encountered: