vmagent: memory overlimit in porto #825
Comments
|
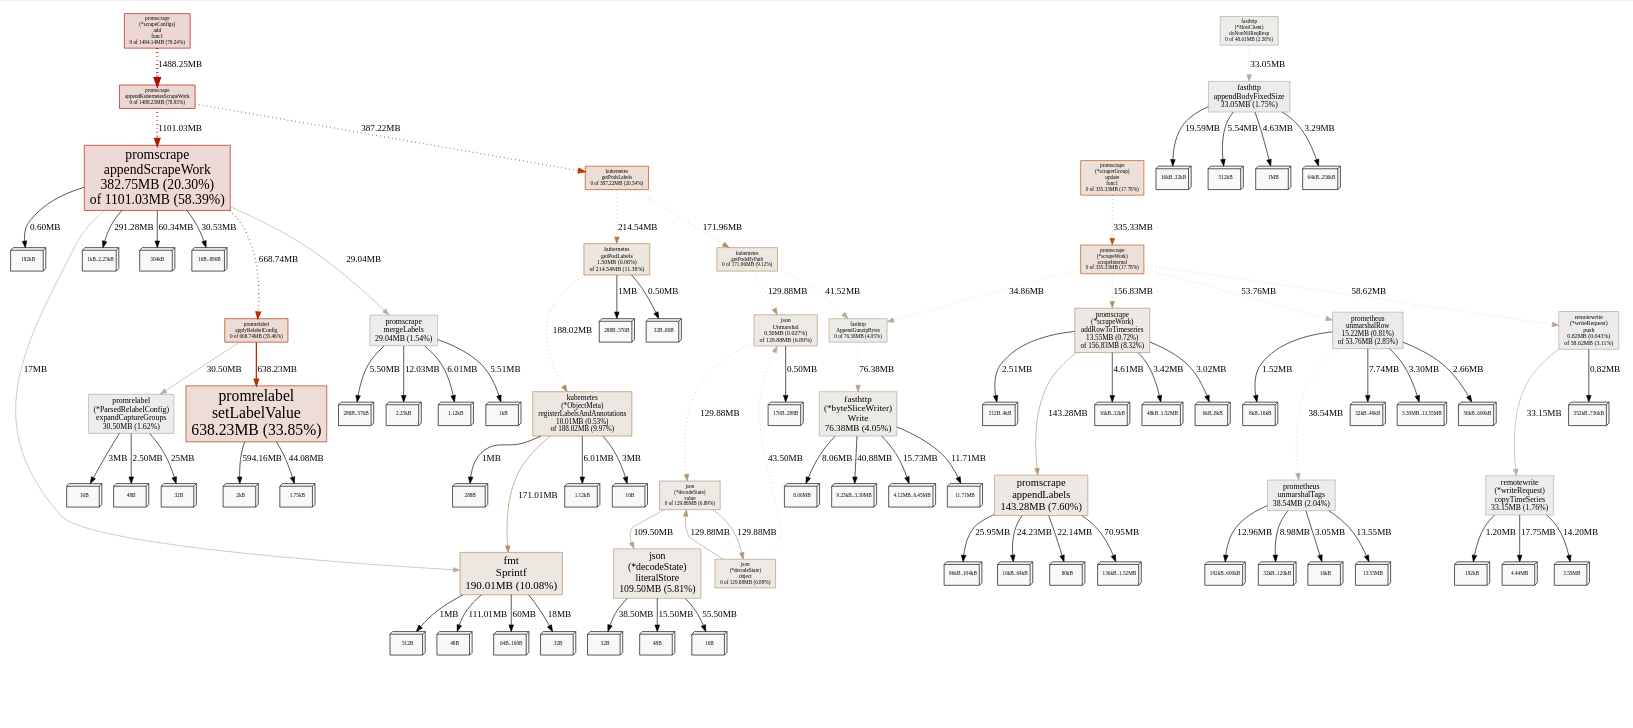
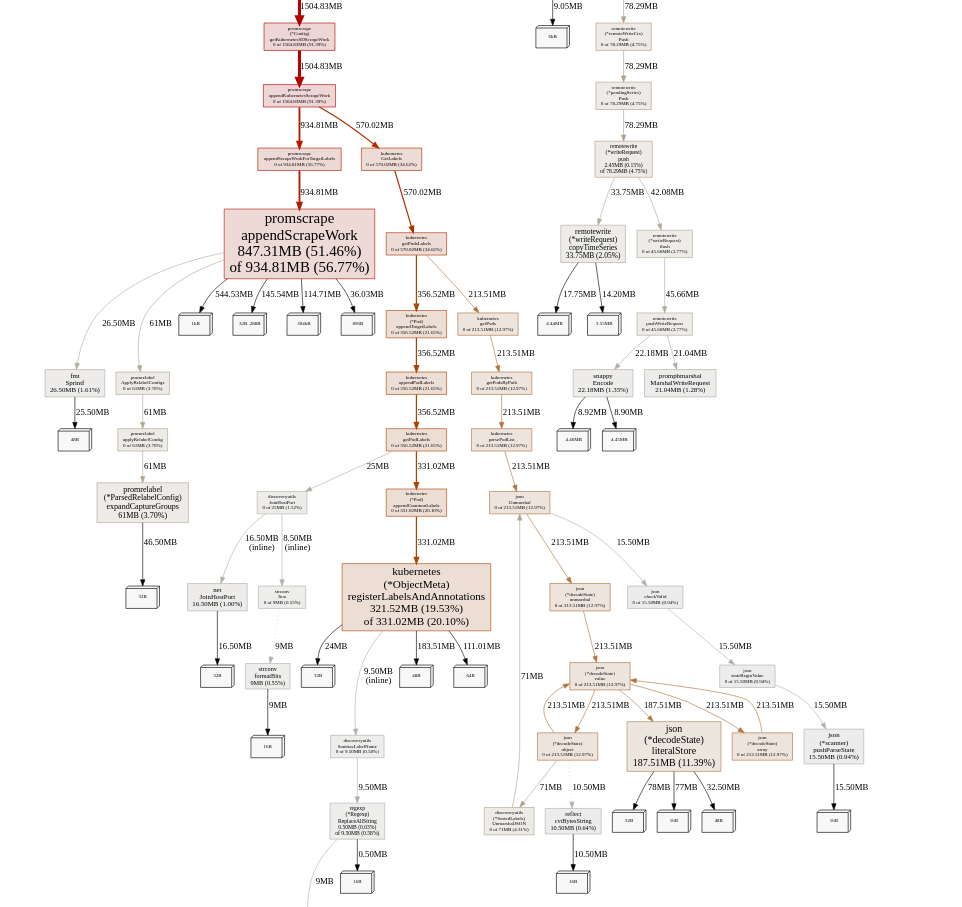
The provided memory profile shows that the majority of memory is consumed during parsing Prometheus data obtained from scrape targets. It is likely Could you verify that |
|
Thanks for the answer. First of all I wanted to understand why vmagent consumes different amount of memory in different environments. Your assumption about GOMAXPROCS definitely make sense. I set env var GOMAXPROCS=8, and the memory consumption significantly decreased, and for some time (hours) even became less than on bare metal. But over time consumption increases, despite of
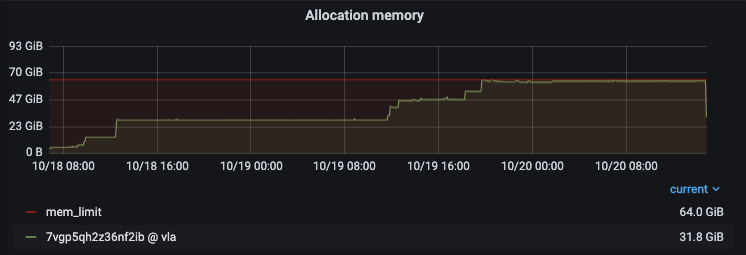
I continue to monitor consumption over time. If it isn't OOM'ed, we can assume that our problem is solved. |

|
It OOM'ed :(
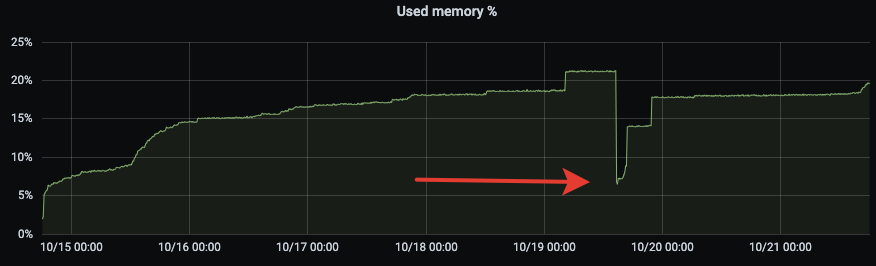
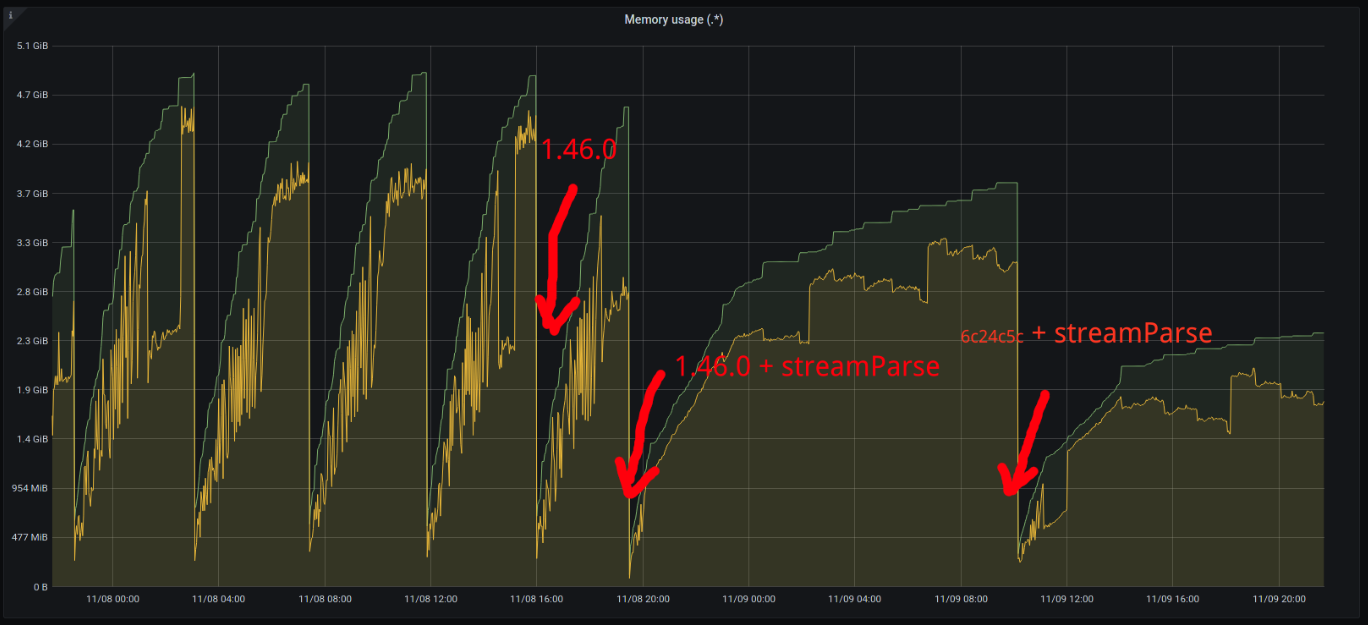
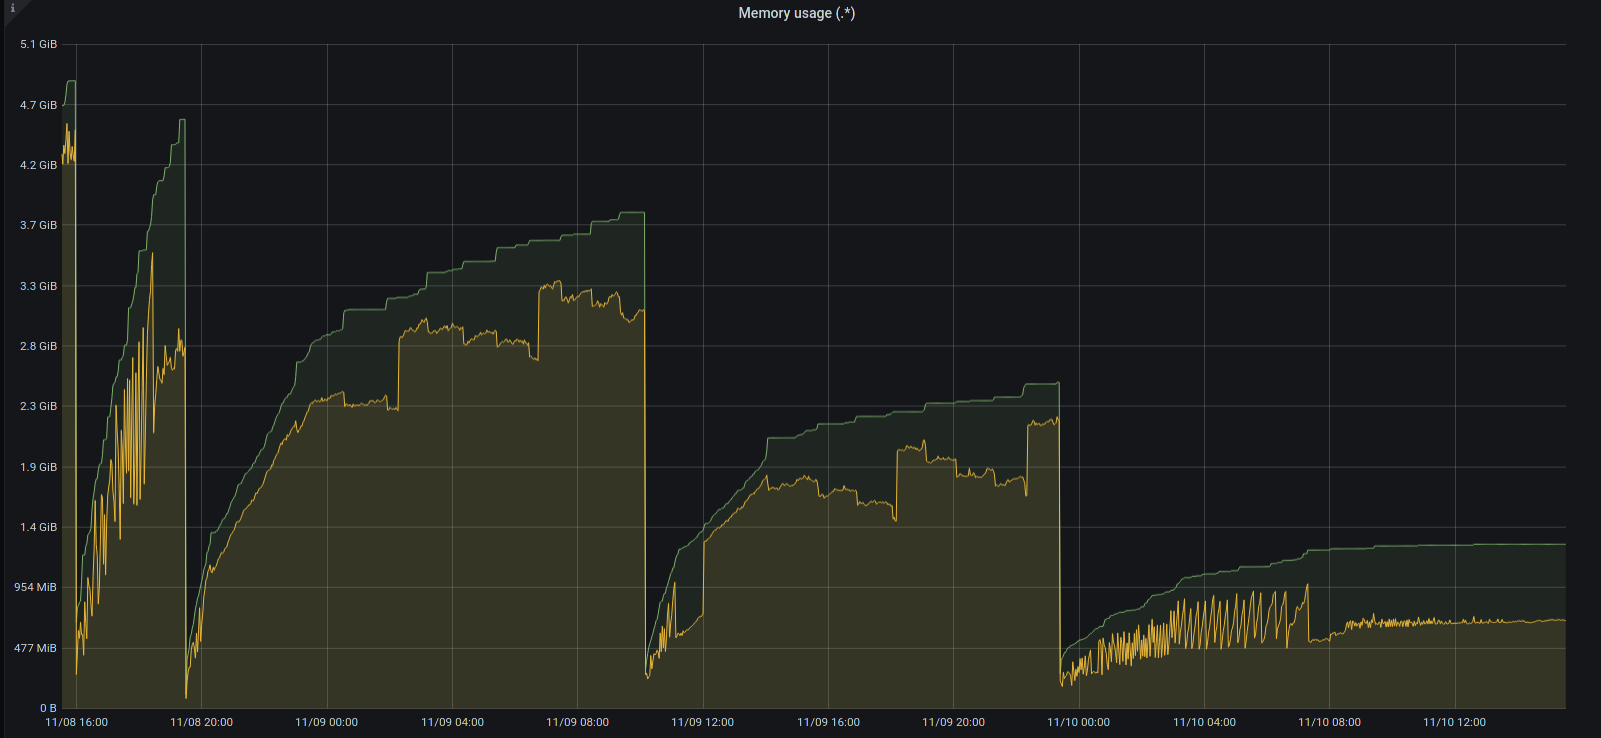
Looks like some memory leak, because memory consumption is growing over time stepwise. This is also noticeable on bare metal servers (the arrow marks the moment of restart):
|
|
I am not sure if we have the same issue. We have vmagent on k8s with a 4GB memory limit. We use the following (memory) option: We have arround 1000 scrape targets and the agent gets oom killed regularly:
Is this a memory leak or do I have to increase the memory limit? |

|
@wf1nder , could you try building @zbindenren , which version of |
|
FYI, stream parsing mode has been included in |
@valyala here the requested memory profile at 3.7GB memory usage. Version of vmagent is 1.45.0. Number of targets: 960. |
|
@zbindenren , thanks for the provided memory profile! Increased memory usage for your case could be related to #878 . Could you build |
|
It is better with master (blue graph), but still increasing. |

|
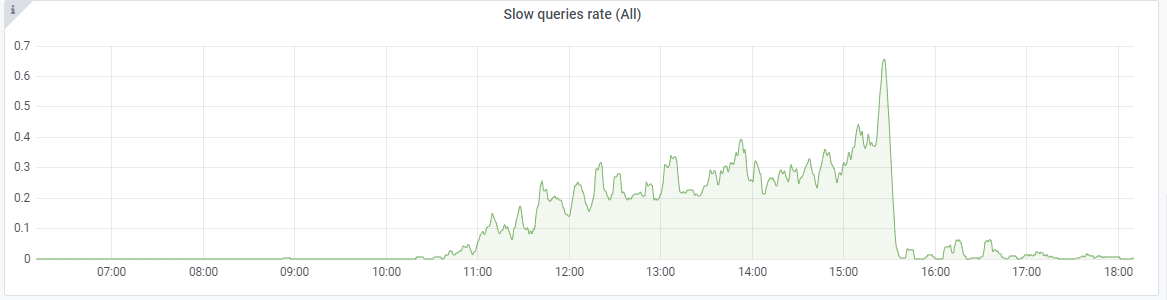
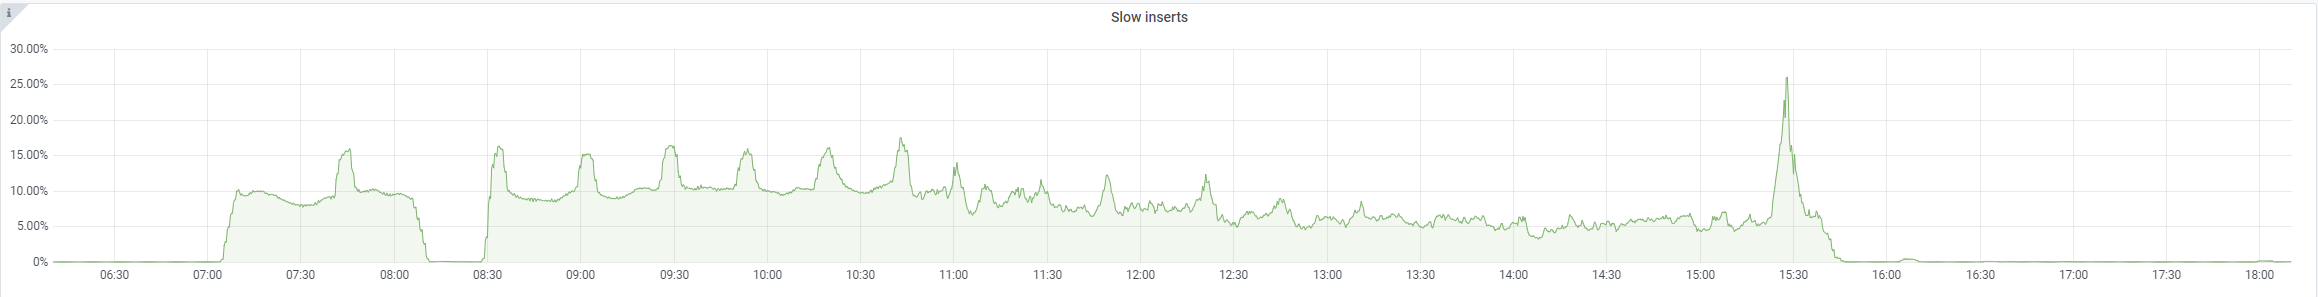
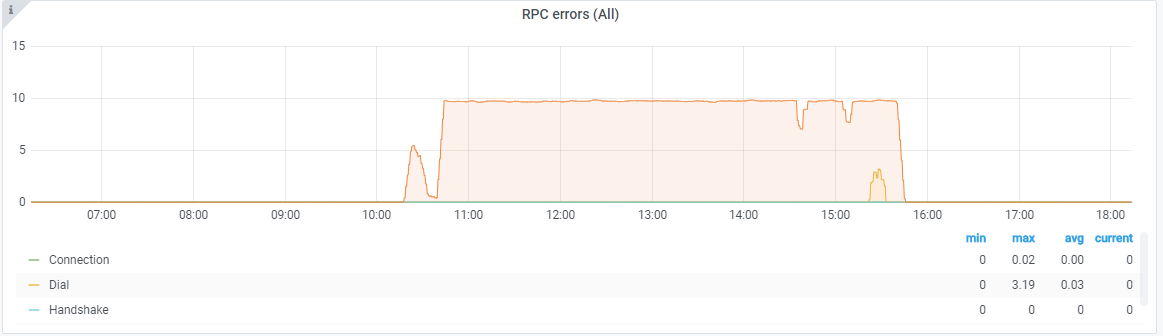
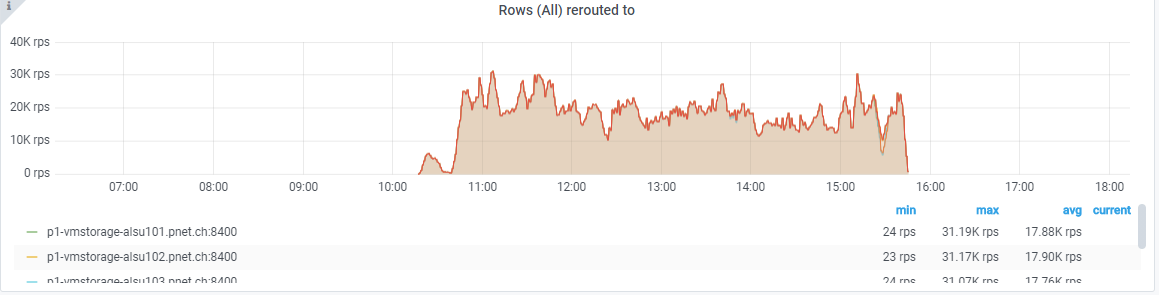
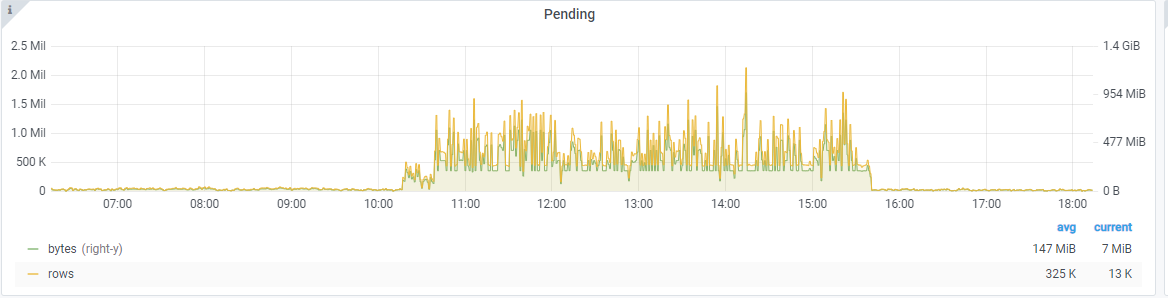
@valyala I think
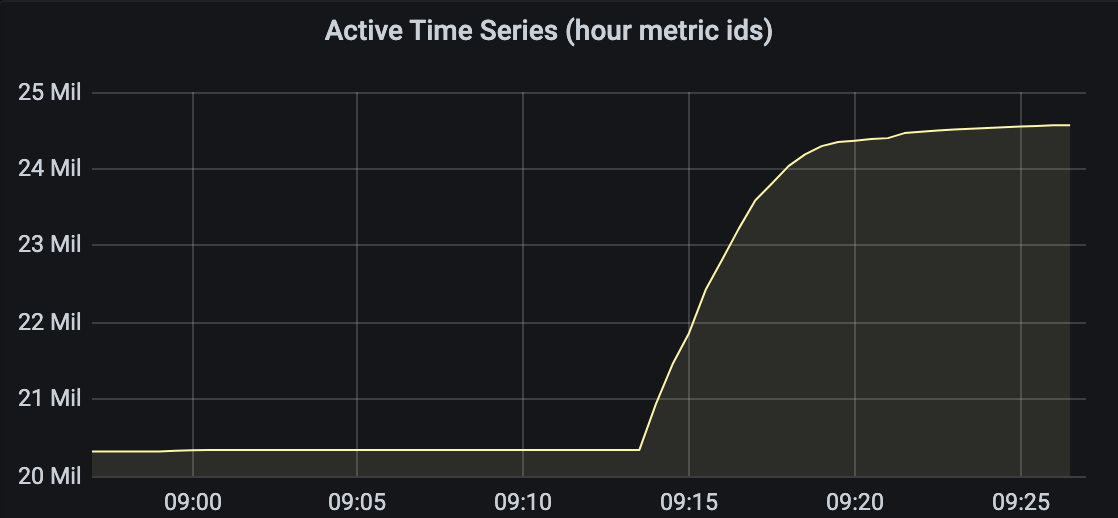
Here the churn rate: Slow queries increased: Slow inserts:
As soon as I disabled the flag, everything went to normal again. |


|
I can confirm, enabling |
|
For streamParse I've noted that metric labels emitted by vmagent sometimes are incorrectly formatted. An example will be smth like |
|
An example of heap profile (for the latest master of b2042a1): Looks like that the main leak is somewhere in |
|
Yet another heap dump after the night of struggle:
|
Previously `-promscrape.streamParse` mode could result in garbage labels for the scraped metrics because of data race.
See #825 (comment)
|
@shuttie , @wf1nder and @zbindenren , thanks for providing useful information about |
Previously `-promscrape.streamParse` mode could result in garbage labels for the scraped metrics because of data race.
See #825 (comment)
…hen discovering big number of scrape targets by using string concatenation instead of fmt.Sprintf

Updates #825
…hen discovering big number of scrape targets by using string concatenation instead of fmt.Sprintf

Updates #825
|
@shuttie , the provided memory profiles show that the majority of memory is used for per-scrape target labels after applying relabeling. Could you share the contents of |
…s after applying per-target relabeling

This should reduce memory usage when per-target relabeling creates big number of temporary labels
with long names and/or values.

See #825
…s after applying per-target relabeling

This should reduce memory usage when per-target relabeling creates big number of temporary labels
with long names and/or values.

See #825
|
FYI, all the commits mentioned above have been included in v1.46.0 release. So the bugfixes could be tested in this release without the need for building |
|
Switching to 1.46 seems to be almost the same as before: The main suspect is still the same: We have approximately active 1700 targets in the /v1/targets response (which seems to be correct), and almost no dropped targets there. But there is quite a high level of target churn by design: each target lifetime is 1-6 hours, so pods are constantly come and leave. The relabel config looks like this: I'm also going to enable |

…els by making a copy of actually used labels

Updates #825
…els by making a copy of actually used labels

Updates #825
|
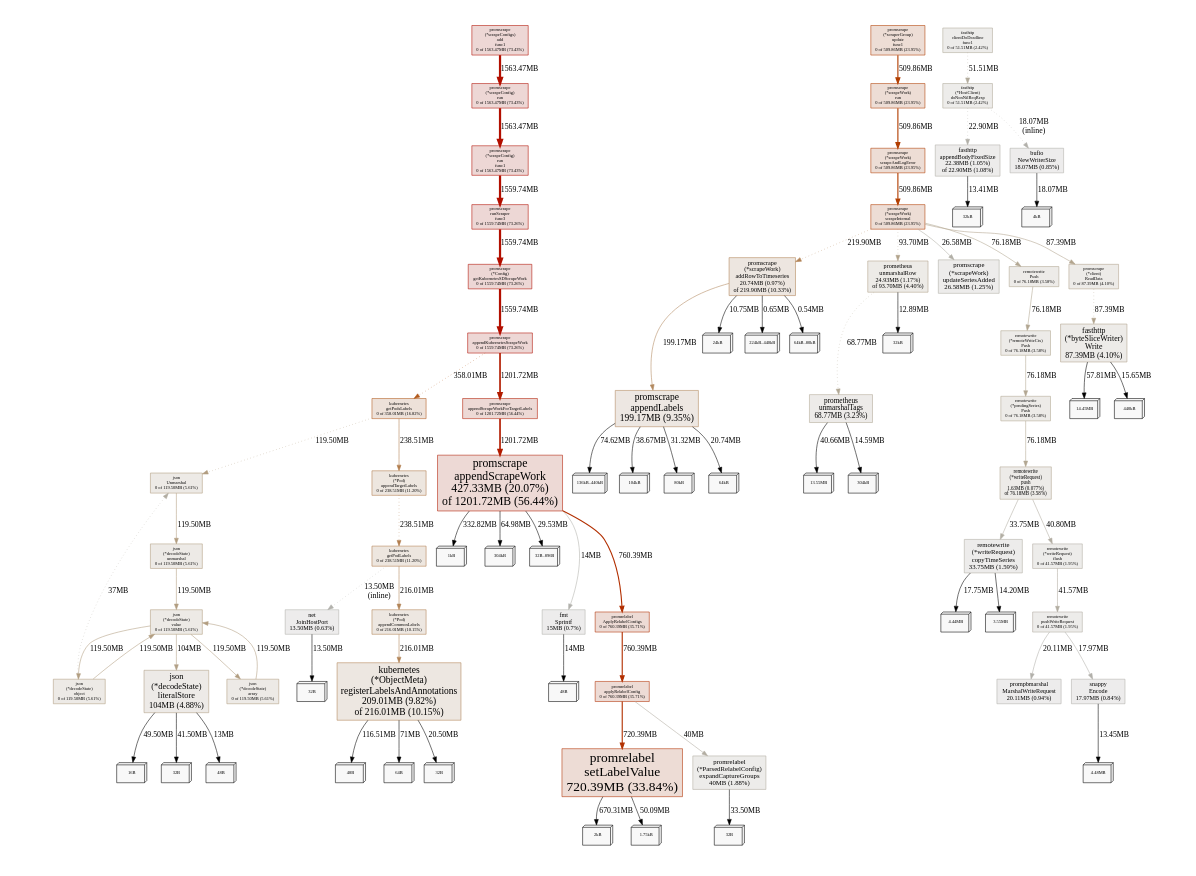
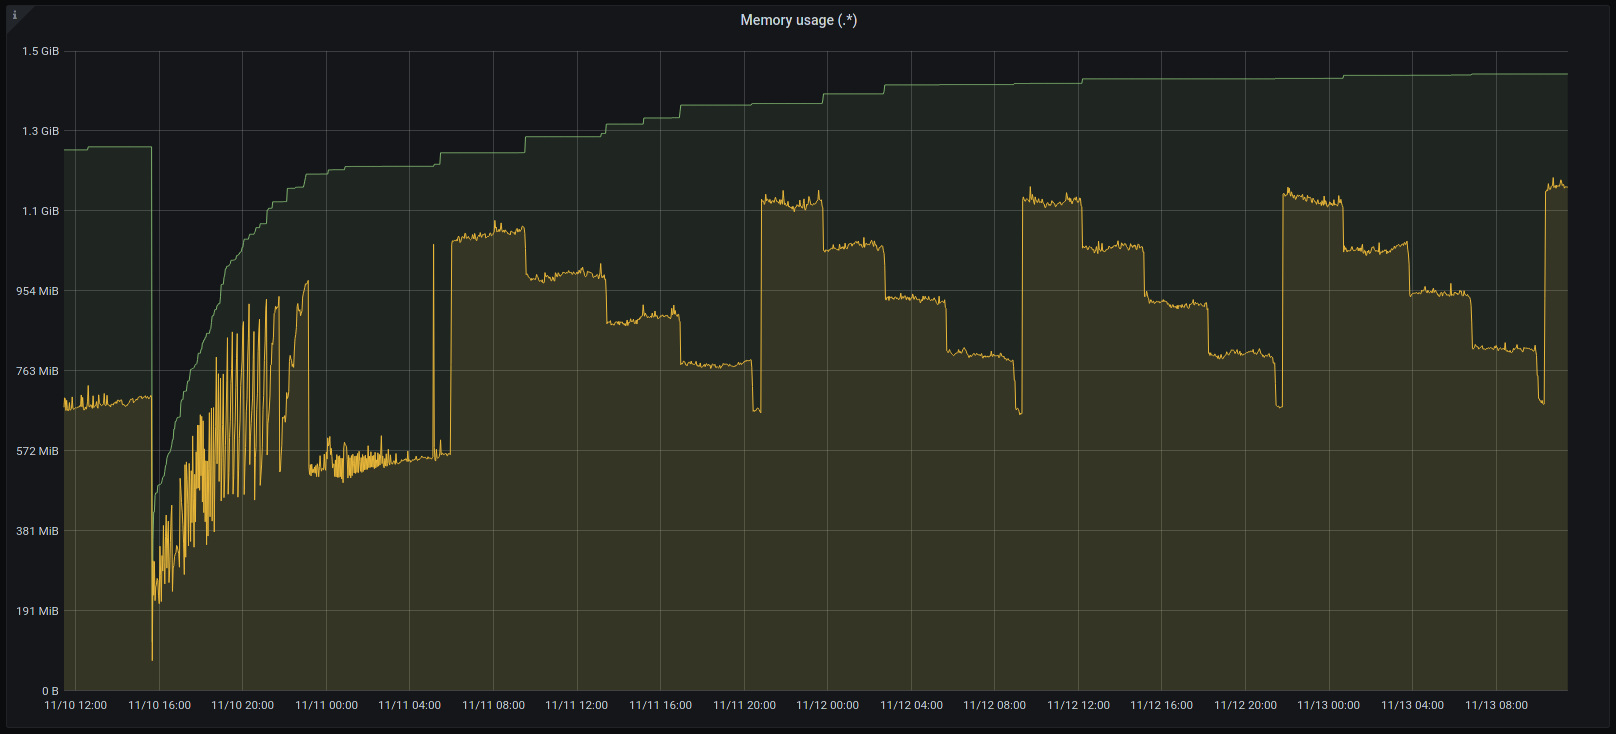
For the last 12 hours with streamParse enabled on 1.46.0, memory usage pattern seems to become different and a bit better: Heap dump: setLabelValue seems to be the main abuser: I'm going to deploy the commit |


|
With a combo of The load and config are still the same. The But it seems to be leaking a bit somewhere in |
|
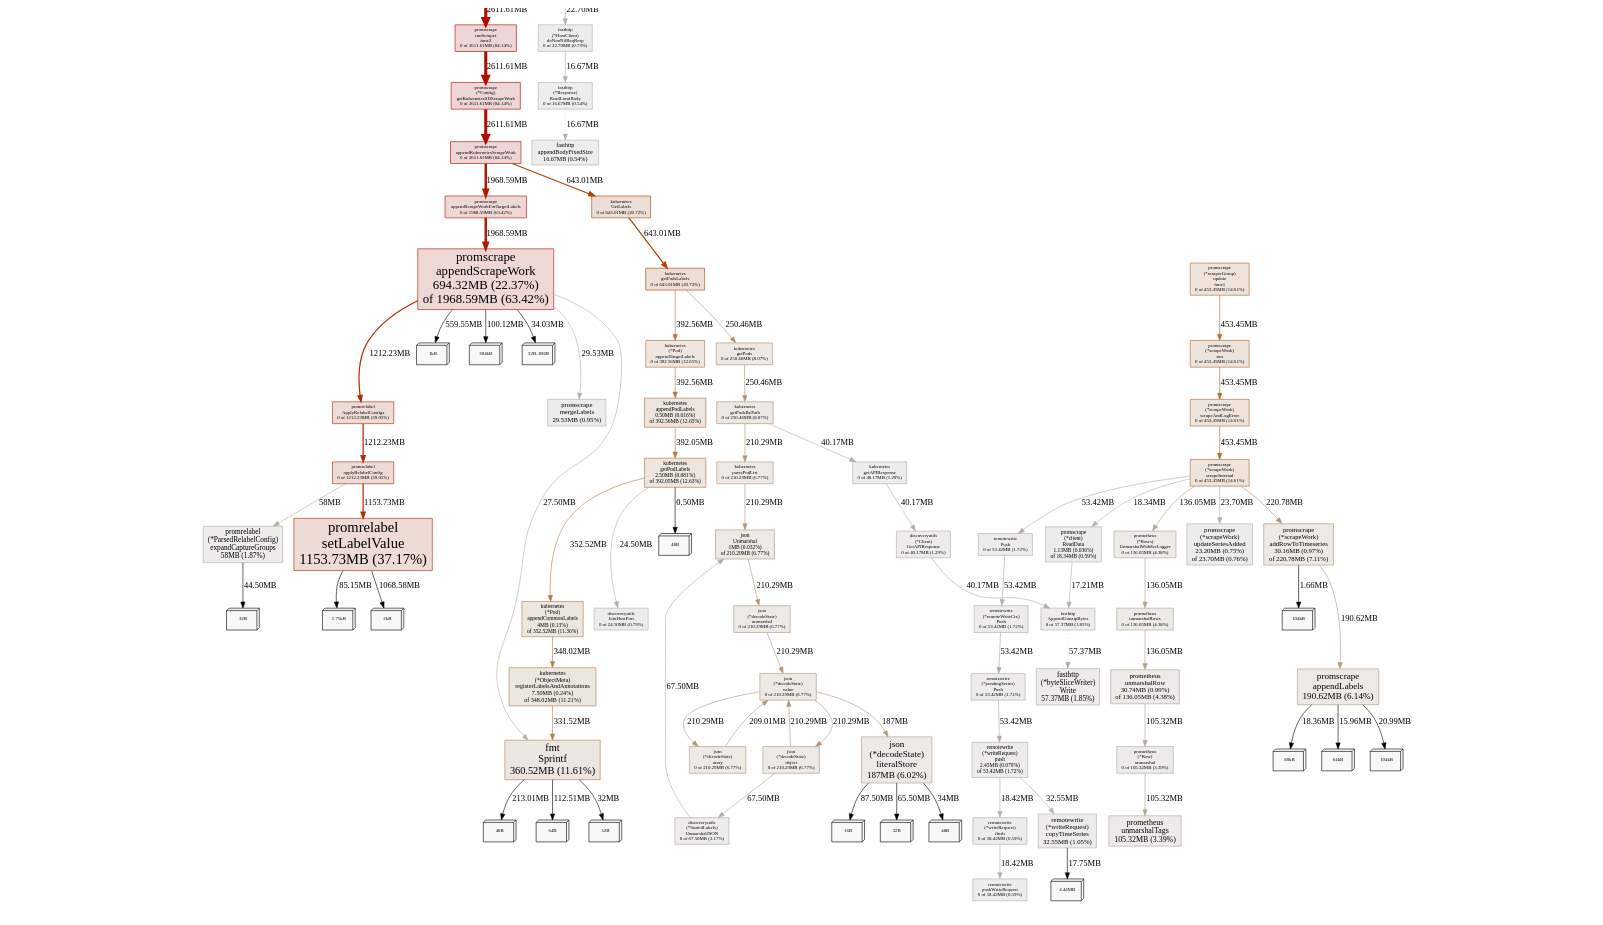
@shuttie , thanks for the update! The provided memory profile shows that 580MB is spent on storing original labels for each scrape target before applying relabeling. These labels are shown at |
…k slice instead of referring to an item in this slice

This should prevent from holding previously discovered []ScrapeWork slices when a part of discovered targets changes over time.
This should reduce memory usage for the case when big number of discovered scrape targets changes over time.

Updates #825
|
After the As an experiment I will deploy the |
|
Looks like garbage metrics when stream parse enabled is not completely fixed.
|
|
So thanks again for the fix! |
@wf1nder , could you try finding metrics with unexpected labels in data collected by vmagent v1.46.0 ? |
|
@shuttie , thanks for update! |
…k slice instead of referring to an item in this slice

This should prevent from holding previously discovered []ScrapeWork slices when a part of discovered targets changes over time.
This should reduce memory usage for the case when big number of discovered scrape targets changes over time.

Updates VictoriaMetrics#825
|
@valyala Honestly, I didn't find a way to find those metrics. I tried to find manually, but we have too many metrics to view it with our eyes. |
|
On the blank vmstorage I exported metrics list by query |
|
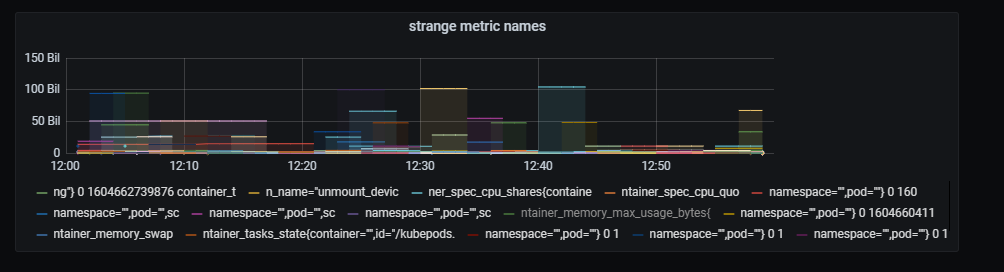
After a while metrics with bad names appeared too. For some reason labels appeared as metric names, for example:
All this must be a labels in some time series, but became as a ts name. |
…ed from `get*ScrapeWork()`

This should prevent from possible 'memory leaks' when a pointer to ScrapeWork item stored in the slice
could prevent from releasing memory occupied by all the ScrapeWork items stored in the slice when they
are no longer used.

See the related commit e205975 and the related issue #825
Hi.
We trying to migrate vmagent from bare metal server to porto container: https://github.com/yandex/porto/
On bare metal we have 128 GB ram, and running vmagent with
-memory.allowedPercent=60option, and normally it uses up to 32 GB after some days from start. After 30 minutes from start it consumes about 15 GB.In porto we giving 64 GB ram for container, and try to run vmagent with all the same options, and less than a minute after start it killing with OOM with exhause all ram. In some reason vmagent trying to allocate too much memory. Also I tried to run vmagent with
-memory.allowedBytes=12884901888(12 GB) option, and it had no effect: the same OOM after few seconds from start.In both cases used last version of vmagent: 1.43.0. All options are the same:
I collected memory profile of vmagent right before OOM in porto, when it reaches about ~64 GB of ram, and sent it to info@victoriametrics.com
Can you please see what the problem might be?
The text was updated successfully, but these errors were encountered: