Project by Jasmine Schoch and Kenneth Yang based on their work in the Virtual Brain Lab (VBL) group, part of the Steinmetz Lab.
One method of gathering brain activity data in neuroscience is known as acute in vivo electrophysiology. This is the technique of inserting silicon tip electrode probes into the brain and reading the electrical signals in the brain. In the Virtual Brain Lab group we develop software to assist scientists in visualizing, planning, and automating these experiments.
We are working with experimental data from research conducted in the Steinmetz Lab. We work with mice and study visual cognition. A typical experiment will consist of showing some visual stimulus to the subject and recording the electrical activity from the neurons in various regions of interest (typically in the visual cortices).
This project is interested in taking the dense electrical signal data from experiments (often involving several insertions) and creating an interactive visualization that will allow users to explore, simulate, and replay the experiment. This will both let scientists gain better insight into the data gathered from the experiment and also let others learn about what data can be found by inserting probes at certain locations.
Our product is both a visualization tool and a method of ingesting the raw data stream from an electrophysiology experiment. This is why we have our components laid out in a Python notebook (letting users ingest their raw data and process it with Python). The format of the data we are using is from the data streams gathered by Anna Li in her research project at the Steinmetz Lab.
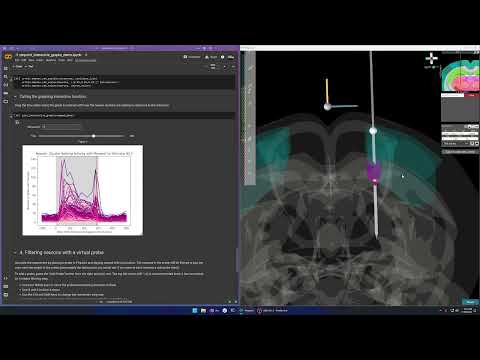
Follow the steps in the linked Colab notebook to ingest Anna's data and interact with it. Experimental data is often a collection of several insertions, creating a point cloud of neurons and their firing rates. The software used, Pinpoint, was developed by us in the Virtual Brain Lab. For this project, we extended its visualization features to enable interactive filtering of neurons and give it a live connection with electrophysiology data pushed from a notebook.
Neurons in the dataset are projected back onto the brain and users can scrub through the timeline of the experiment to see how external stimuli affect the firing rates of these neurons. As firing rates increase for a particular stimulus, neurons will get larger. Their color is an indication of their average across all stimuli. Since this dataset (and our lab) is mostly concerned with the visual cortices, only the visual cortex of the brain was highlighted in the 3D visualization (color was determined by Allen Insittute's coloring scheme). Neurons were colored pink/purple to contrast. Users can then insert a probe into the scene and play around with its orientation to see what kind of data they could have gathered from this experiment's dataset had they used this insertion. Scientists may want to try out various insertions to verify they can gain access to other regions or try to handle the geometry of their rigs. Students may want to try out various insertions to get more familiar with how the structures of the brain are organized and get a better understanding of the kind of visibility they could have into certain regions.