
First, clone or download this repository's files and place them in your Grafana plugins folder, typically found in <path/to/grafana>/data/plugins or, on Linux systems, the plugin directory is /var/lib/grafana/plugins. You can place them in a DPM folder, such as /var/lib/grafana/plugins/dpm/.
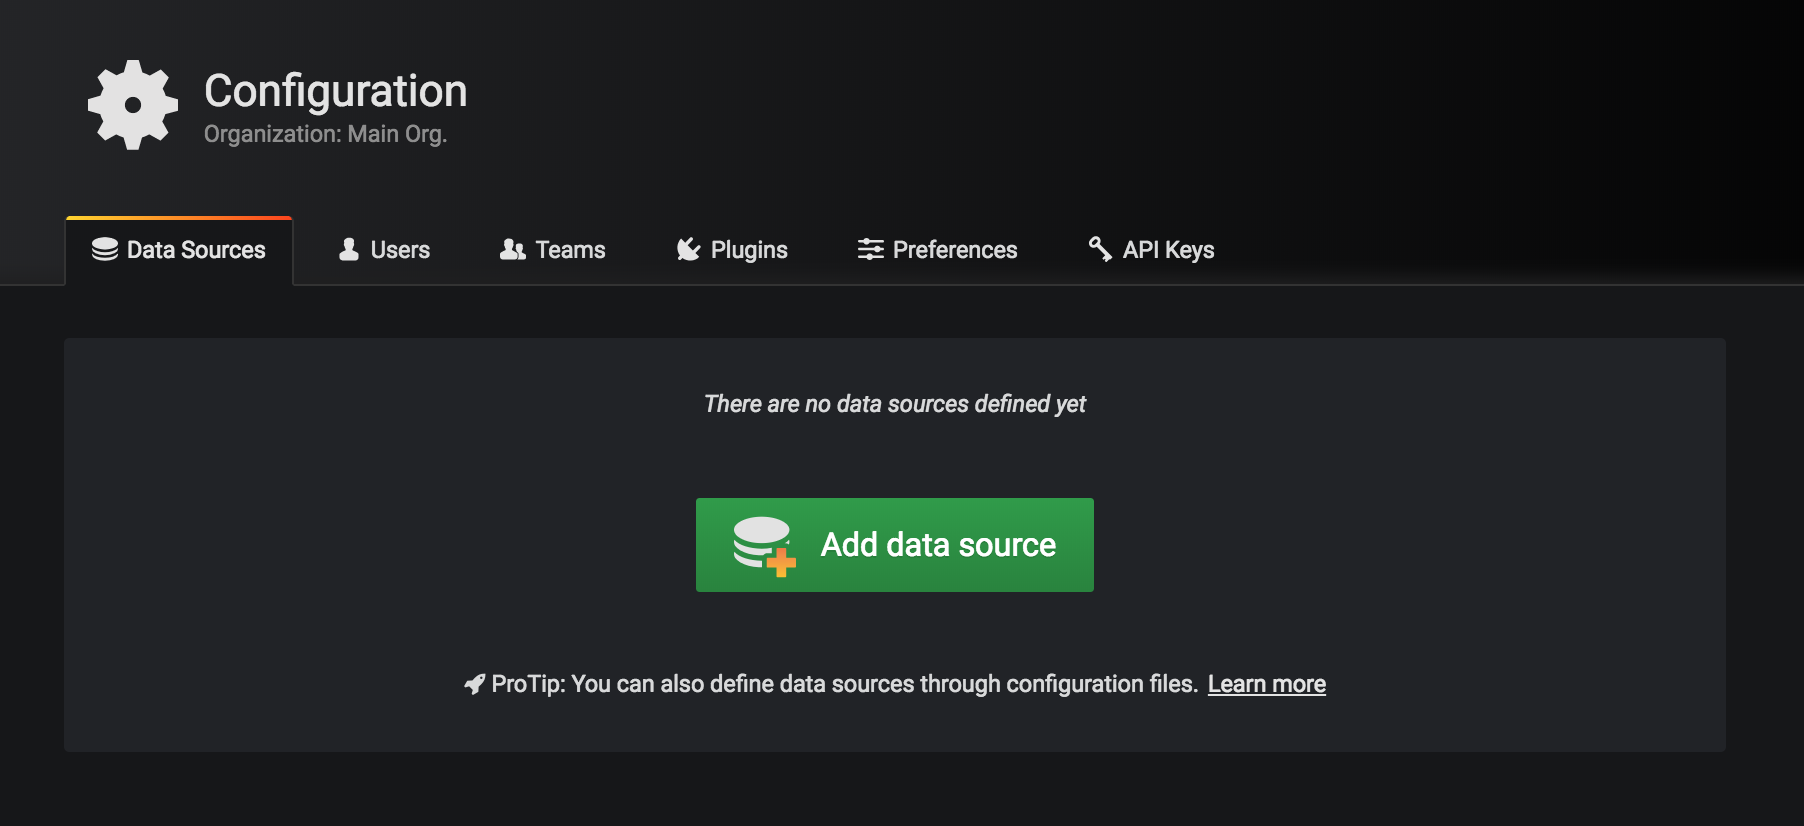
Restart Grafana, log in, and go to Configuration > Data Sources > Add data source:
Select SolarWinds DPM:

Enter your DPM API token. To generate an API token, log into SolarWinds DPM and select the environment you want to pull metrics from. Go to Settings, and under Environment Settings, choose API Tokens.

Then Save. It should display a success message if the configured token is working.

Optional: if, for any reason, you need to configure a different API URL, you can use the API URL field in the datasource configuration. Otherwise you can leave it empty, as it's not required.
In the panel configuration, select the SolarWinds DPM Data Source:

You will see a row with a dropdown (to select the metric) and a text input (to filter your hosts).
The dropdown will show metrics that match what you have typed, which makes searching easier:

The hosts filter shares some features with the DPM app:
- By default, if you type api, any host whose name includes the substring api will become part of the set of active hosts.
- You can match hostnames exactly by wrapping them with the double quotes sign. The string "api2", for example, will match a host named api2 but not one named api20.
- You can exclude hosts from the selection by negating them with a minus sign. For example, -"api20".
- You can select hosts by their type (os, mysql, pgsql, redis and mongo at present), with syntax such as type=os or type=mysql.
Select a metric, filter your desired hosts and click on the eye icon to preview.
Learn more about metric categories
Sample configuration:

When defining a graph, it's supported in both the metric picker and host filter the use of variables. These variables will be interpolated with the currently selected value when the datasource requests for data.

Variables, with SolarWinds DPM as the datasource, will use the query field to match with metric names
(e.g. mysql. will match with mysql metrics). Alternatively, you can use the special string $hosts
and get host names as possible values.
Read more about variables in the Grafana documentation.
- Place this project in your plugins directory or /data/plugins
- Install dependencies.
yarn installornpm install - Run the tests.
yarn testornpm run test - Build to distribute or test.
yarn buildornpm run build - Alternatively, use the watch script with
yarn watchornpm run watch
The code is automatically formatted using Prettier in a pre-commit hook.
Run the linter with yarn lint or npm run lint.
Change the files as you need and send a PR with no build files on it. After you get your PR approved you can merge it to master.
We follow the Semantic Versioning guidelines.
- CSS loading spinner by Luke Haas