This repository will host the Global Fishing Watch client application developed by vizzuality
Start by installing the required nodejs packages using npm (already bundled with recent nodejs installations)
npm install
Create a .env file from the provided sample and set the missing values accordingly
Next, start the server by running:
node server.js
You should be able to access your application at http://localhost:3000/
The project includes a set of hooks to automatize boring tasks as well as ensure code quality. To use them, simply enable to built-in git hook manager:
./bin/git/init-hooks
You only need to do this once. If new hooks/changes to existing hooks are brought from upstream, the git hook manager will automatically use them without requiring further actions from you.
Note that as of now, before we fix all errors on the existing codebase, the push will carry on even with errors.
To compile the project to production environment, you need set the NODE_ENV variable value to production and
execute the following command.
npm run build
This command generates a dist folder with the files needed to run application in a nginx or apache server. Your
server needs to be configured to serve all routers from a static index.html file.
Example nginx config
server {
    listen 80;
    server_name myserver;

    location / {
        root    /labs/Projects/Nodebook/public;
        index   index.html;
        try_files $uri /index.html;
    }

}
Example apache configure
Options +FollowSymLinks
IndexIgnore */*
RewriteEngine On
RewriteCond %{REQUEST_FILENAME} !-f
RewriteCond %{REQUEST_FILENAME} !-d
RewriteRule (.*) index.html
On server error, the /public/500.html page should be displayed.
Port in which the node server will listen for incoming connections
Server subpath over which the application will be served. May be empty if the application should load through relative urls, or a static path for loading through an absolute url. If not empty, it must start and end with a / character (such as /map/).
API key for Google Maps
Environment in which the node server will run (production/development)
If true, the map will display the header, and footer on the map page. If false, the app will only render the map (full window size) and the sidebar.
Endpoint of the API (vessel tiles, workspace, contact, etc)
URL of the blog
URL of the main site
URL of the map on the main site
Boolean value to determine if the user needs to be logged in to access the map (setting to false is experimental)
Google Analytics tracking code.
Name/ID of the default workspace to be loaded on the map (if USE_LOCAL_WORKSPACE is set to false, see below)
If set, should point to the local workspace to be loaded
Disable welcome modal. Typically enabled in a dev environment, disabled in prod
Key used to read the welcome modal's url cookie. On load, the app will look for a cookie named with the specified key. If any cookie matches the WELCOME_MODAL_COOKIE_KEY and the url of the cookie is new, the html content will be loaded in a modal. EXAMPLE: If WELCOME_MODAL_COOKIE_KEY is set to GlobalFishingWatchNewsletter the cookie's name must also be GlobalFishingWatchNewsletter.
Endpoint where the JSON timebar data is hosted. Typically enabled as /timebar/.
URL pattern used on the share feature. It must be of type http://your-site.com/?workspace={workspace_id}, where {workspace_id} will be replaced by the actual workspace ID.
Display message contained in literals.json's banner in a dismissable banner on top of the map. Boolean value.
Enable usage of the new "Area of Interest" feature (experimental)
Enable usage of the new "Subscription" feature
On load, the application will call the /me API endpoint to load user permissions. These are the supported values:
Allows a user to select a vessel by clicking on it on the heatmap
Allows a user to see a vessel layer (filters by layer type)
Allows a user to see vessel's basic info
Allows a user to see all available vessel info
Allows a user to use the "share" feature
Allows a user to see the map
Allows a user to use the search feature
Allows a user to upload custom layers
Allows a user to report on report-enabled layers
Allows a user to pin a vessel
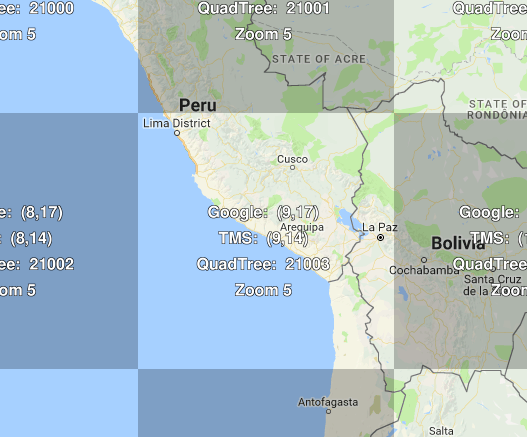
x, y represent tile coordinates at zoom level 5.
Triggered when an user changed the viewed area. It is not triggered below zoom level 5. To match an x, y value with an area of the planet, one can go on this page, zoom at level 5 and compare with values written within the tiles under "Google: (x, y)".
For example, the coast along Peru and Argentina would be 9, 17 here:
It is possible from this data to generate a map showing a map with the most viewed parts of the world, such as:

To do so:
- get a CSV of the data from GA
- save it as analytics-tiles.csv under bin
- run
node ./bin/analytics-tiles.js. This will convert tile coordinates to lat/lon pairs, and output the result as CSV - put this data into Carto
Returns the length of the new inner extent in days.