Script to plot the histogram of sequence length in a given fasta file.
usage: fasta_length_hist.py [-h] -i INPUT [-o OUTPUT] [-of {pdf,png,jpeg}]
                            [--x_log] [--y_log] [--grid] [--xmin XMIN]
                            [--xmax XMAX]

fasta_length_hist.py v1.0

optional arguments:
  -h, --help            show this help message and exit
  -i INPUT, --input INPUT
                        The fasta file to process
  -o OUTPUT, --output OUTPUT
                        The output file of the histogram. Default:seqHist.pdf
  -of {pdf,png,jpeg}, --format {pdf,png,jpeg}
                        Set ouput format. Default to "pdf"
  --x_log               xAxis will be set to a log scale
  --y_log               yAxis will be set to a log scale
  --grid                Trun on grid of the plot
  --xmin XMIN           Set the limits (min) of x-axis
  --xmax XMAX           Set the limits (max) of x-axis
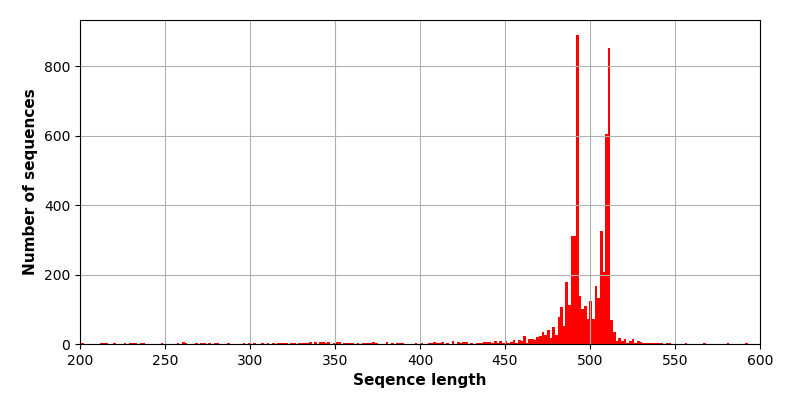
Here we plot the distribution of sequence lengths from a FASTA file sample.fasta.
python fasta_length_hist.py --input sample.fasta -of png --xmin 200 --xmax 600 --grid