Skip to content
New issue

Have a question about this project? Sign up for a free GitHub account to open an issue and contact its maintainers and the community.

By clicking “Sign up for GitHub”, you agree to our terms of service and privacy statement. We’ll occasionally send you account related emails.

Already on GitHub? Sign in to your account

How can I add colored tile under the tip label? #25

Closed
ARise-fox opened this issue Nov 22, 2022 · 3 comments
Closed

How can I add colored tile under the tip label? #25

ARise-fox opened this issue Nov 22, 2022 · 3 comments

Comments

@ARise-fox
Copy link

I learned that use geom_fruit and geom_tile can add bars to the circular tree graph, but when my tip nodes do not have the same x value, some tiles cannot be shown on the plot with the warning message

Warning message: Removed 1 rows containing missing values (geom_tile()).

and here is my output figure:

Screen Shot 2022-11-22 at 15 46 22

It's clear that node "Microcoleus_asticus_IPMA8" has no colored shading.

I want to get a figure like these followings, having colored ring under species the tip label, and grouped by phylum.
471668565109_ pic_hd
431668565057_ pic_hd

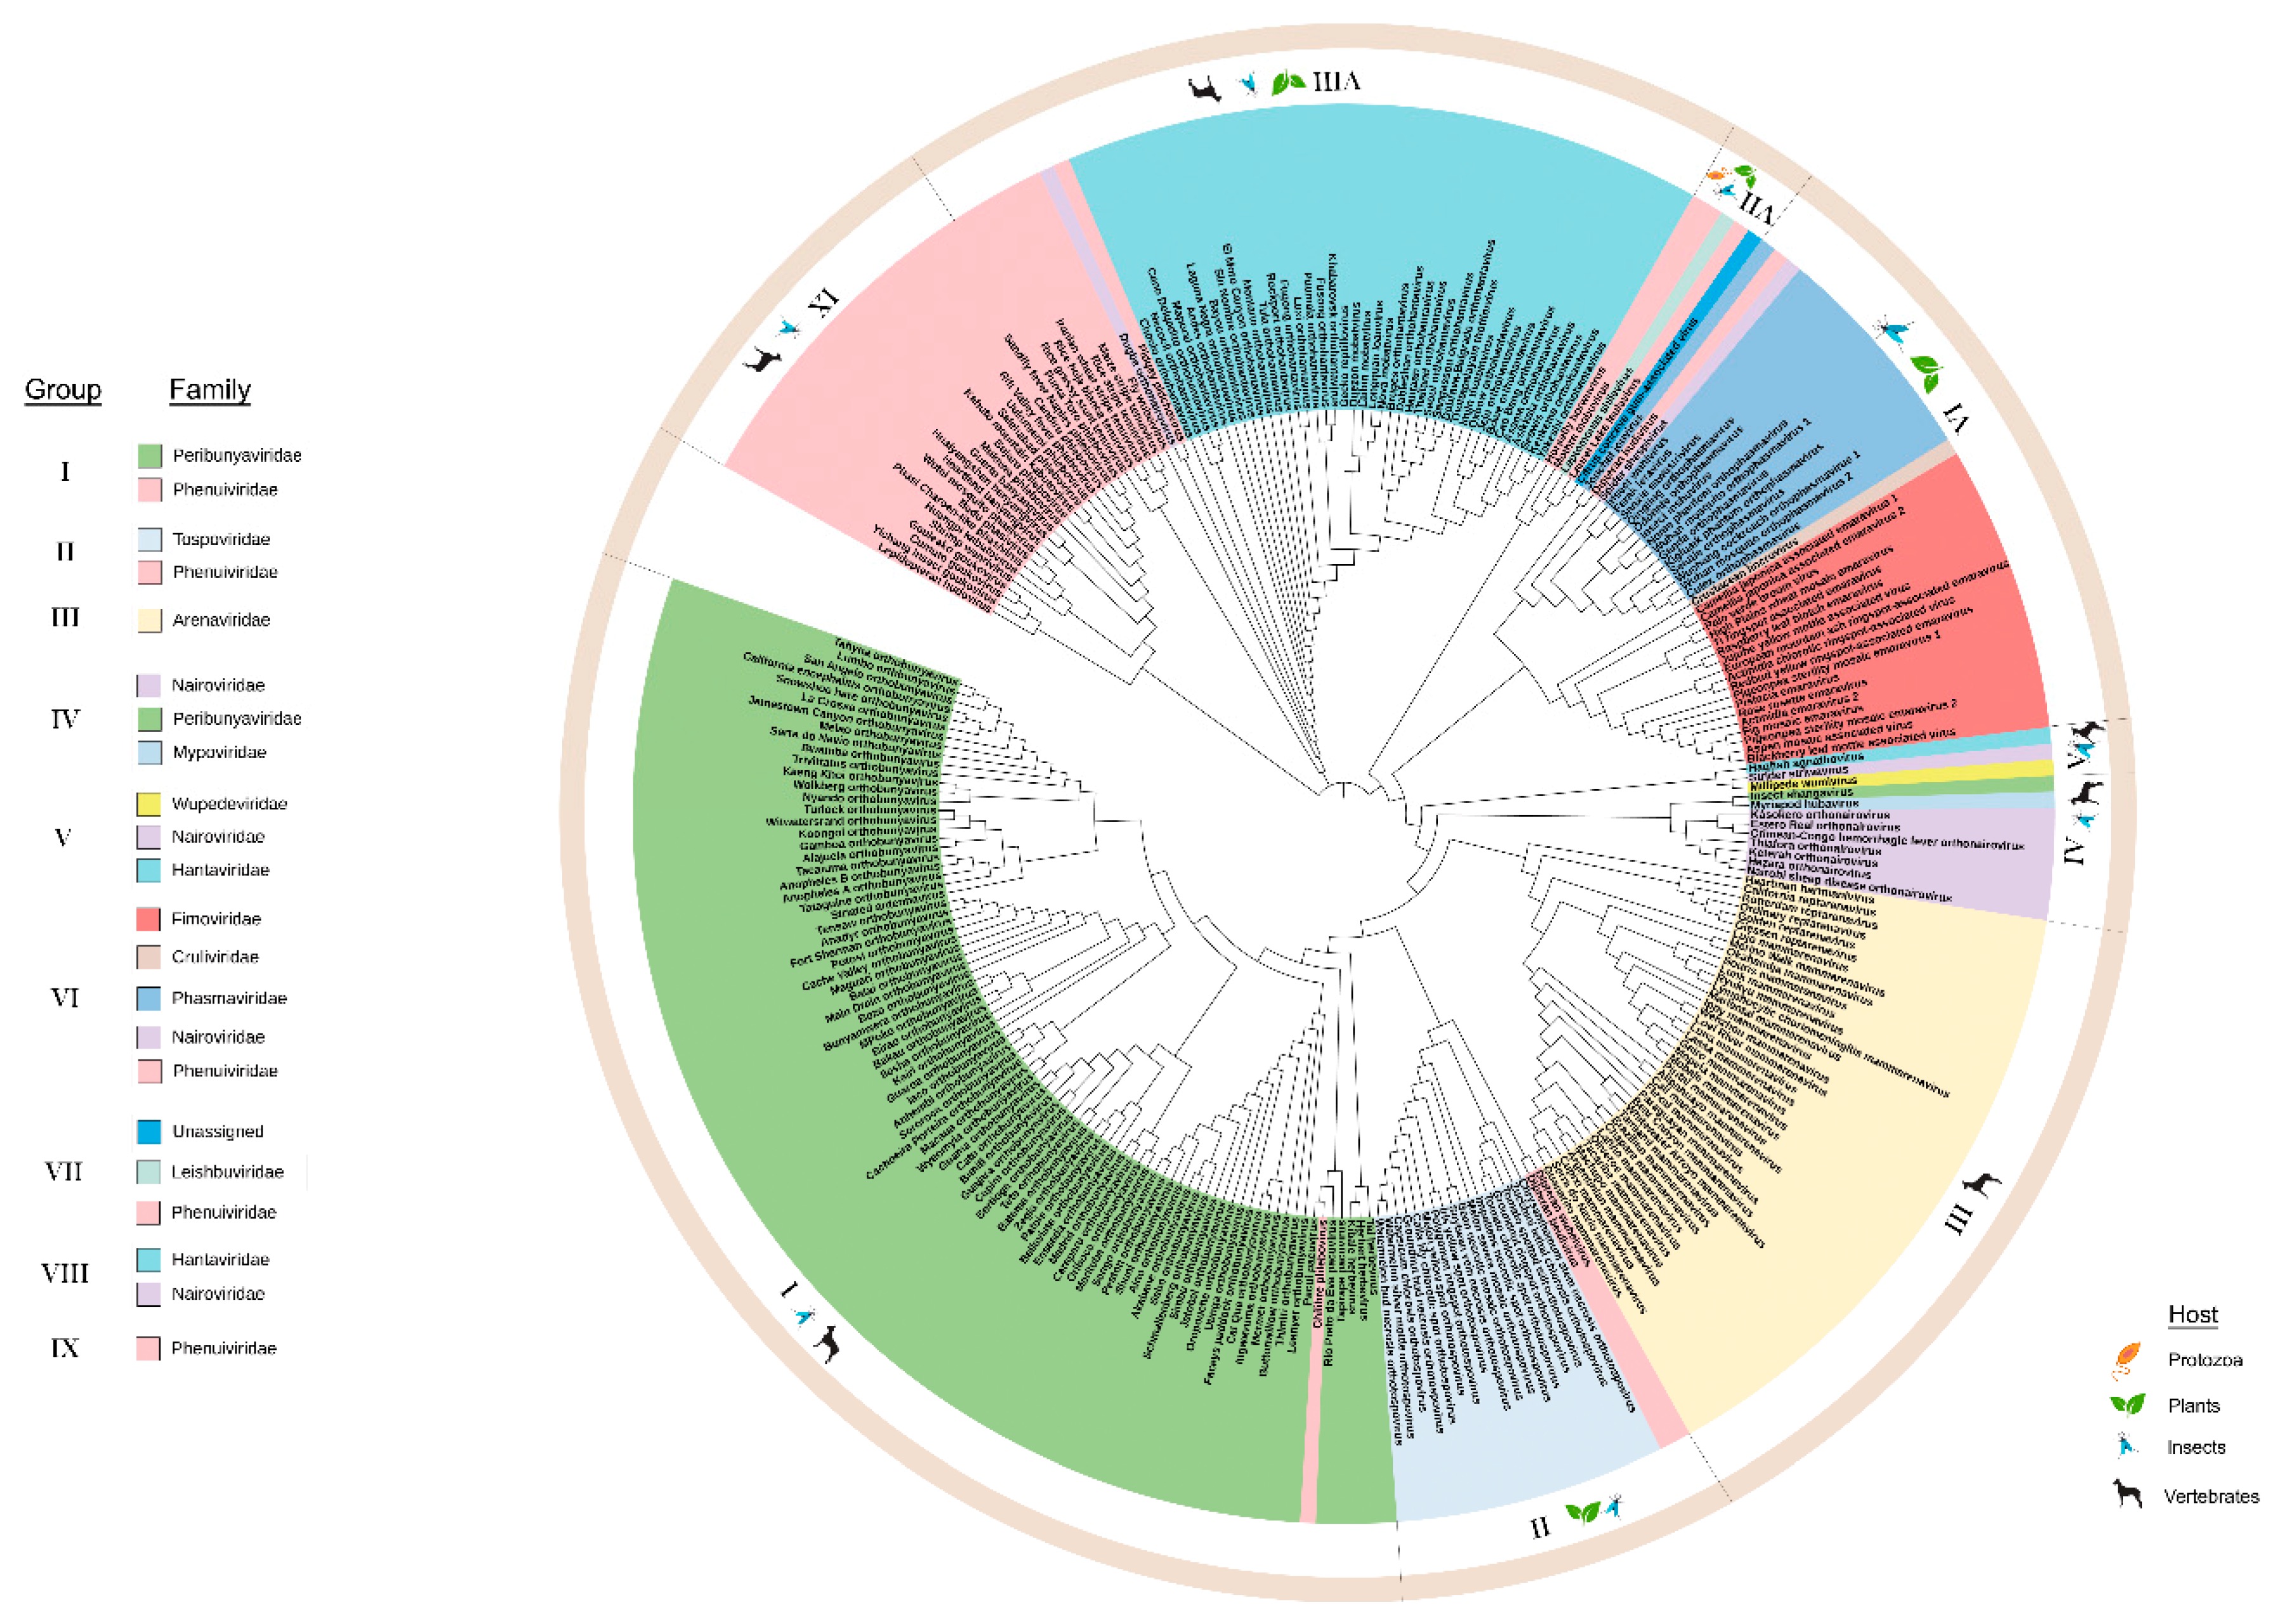
Could you please offer me some help? How can I make figures like these using ggtree and ggtree extra?
Here is my code and origin file:

tree_file:
id50.txt
csv_file:
id50_items.csv

tree=read.tree(tree_file)
data=fortify(tree)
data_csv <- read.csv(csv_file, check.names = FALSE) #记录物种分类信息
data_csv[data_csv == ''] <- NA
# la:"domain"  "kingdom" "phylum"  "class"   "order"   "family"  "genus"   "species"
la <- names(data_csv)[-1]
mer_col <- c(names(data),names(data_csv))
full.df <- data.frame()
for (i in la) {
  # la的第一个,也就是data_csv的第二个,遍历到names(data_csv) = i 的index
  j1<-left_join(data, data_csv, by=c("label"= i))
  na.omit(j1) ->j2
  j2$input_term <- j2$label 
  # 加入名称为i的列
  j2$temp = j2$label 
  colnames(j2)[colnames(j2) == "temp"] <- i 
  # 按顺序排列
  j2 <- j2[,mer_col]
  # 该level后全设NA
  if(i != "species"){
    j2[,c((which(mer_col == i)+1):ncol(j2))] <- NA
  }
  j2 <- distinct(j2,.keep_all = T) 
  rbind(full.df,j2) %>%  distinct(.keep_all = T) -> full.df 
}
# 未匹配情况,包含根结点和非标准分类元
nomap.df <- subset(data, node %in% data$node & !node %in% full.df$node )
# 合并未匹配情况
left_join(nomap.df,data_csv,by = c("label" = "input_term"))%>%
  mutate(input_term=label)%>%
  rbind(full.df,.) -> full.df

# draw circular graph
cirgraph <- ggtree(tree, layout = "circular") + 
  # geom_hilight(data=pdata, aes(node=node, fill=phylum),type = "auto")+
  geom_tippoint(data = data, size=1)+
  # geom_tiplab(data=data, size = 2,align=T, linetype=3, linesize=0.5, hjust=-0.02, aes(color = phylum))+
  geom_nodepoint(size=0.5, color="steelblue")+
  xlim(NA, max(data$x)*1.3)

# dataframe to add annotation
dat2 <- full.df[,c("node","x","label", "phylum")]

p3 <- cirgraph +
  geom_fruit(
    data = dat2,
    geom = geom_tile,
    mapping=aes(x,y=label , fill=phylum),
    alpha = 0.4,
    offset=0.1,   # The distance between layers, default is 0.03 of x range of tree.
    pwidth=0.4, # width of the layer, default is 0.2 of x range of tree.
    # the `position` parameter was set to `identity` to add the points on the tip nodes.
    # position=position_identityx(hexpand = 8),
  ) +
  geom_tiplab(size = 1.4,align=T, linetype=3, linesize=0.5, hjust=-0.02, offset = 2)
@ARise-fox
Copy link
Author

Also, I can't set the param offset and pwidth too high like offset=0.2, pwidth=0.2 , or else there will be a message:
Warning message:
Removed 50 rows containing missing values (geom_tile()).
I guess that indicate the tile elements is drawn out of layer scope.

@xiangpin
Copy link
Member

Also, I can't set the param offset and pwidth too high like offset=0.2, pwidth=0.2 , or else there will be a message:
Warning message:
Removed 50 rows containing missing values (geom_tile()).
I guess that indicate the tile elements is drawn out of layer scope.

This is because you use xlim, the layer was removed, set a bigger value can solve the problem, or don't use it when using circular layout. In addition, when x only have one unique value, and you are using geom_tile, please use width argument of geom_tile to replace pwidth, you can refer to the answer.

It's clear that node "Microcoleus_asticus_IPMA8" has no colored shading.

This is because the tip.label of tree is Microcoleus_asticus_IPMA8, but the dat you provided is others.

You can refer to the following codes.

library(ggtree)
library(ggtreeExtra)

tr <- read.tree('./id50.txt')

dat <- read.csv('./id50_items.csv')


# You should provide a column the same with tip.labels of tree
# You can find the input_term does not contain 's__' but
# The tip.label contains except Microcoleus_asticus_IPMA8.
dat$input_term
tr$tip.label <- gsub("s__", "", tr$tip.label)

# Then you can use left_join to integrate the dat.
tr %<>% dplyr::left_join(dat, by=c('label'='input_term'))

p <- ggtree(tr, layout='fan', open.angle=0) +
     geom_tiplab(align = TRUE, size = 3)

# Since the dat had been integrated to the tree, you don't
# need provide again, and the y of mapping also don't need
# specify.
p <- p + geom_fruit(
        geom=geom_tile,
        mapping=aes(fill=phylum),
        alpha=.3,
        width=10,
        offset=.55
     )
p       

xx

@ARise-fox
Copy link
Author

Thank you very much! The problem that had been bothering me for a long time was finally solved.

Sign up for free to join this conversation on GitHub. Already have an account? Sign in to comment
Labels
None yet
Projects
None yet
Development

No branches or pull requests

3 participants