

Leaflet layer based on Vega visualization grammar
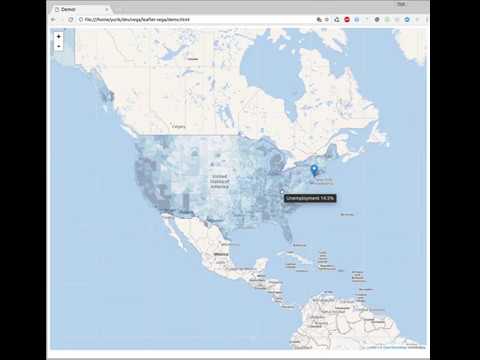
This Leaflet plugin adds a Vega layer on top of the map, and provides two way signaling between Leaflet and Vega. This way a complex Vega-based visualization can be added to a map without any additional JavaScript.
- Clone the repo
- open
demo/demo.htmlfile directly in your browser. No server is needed.
const map = L.map('map');
// Optionally, add a base layer
L.tileLayer('https://maps.wikimedia.org/osm-intl/{z}/{x}/{y}.png', {
attribution: '© <a href="http://osm.org/copyright">OpenStreetMap</a> contributors'
}).addTo(map);
// Add a Vega graph to the map
L.vegaLayer(vegaGrapSpec).addTo(map);Optionally, provide additional parameters to vegaLayer():
vega- custom instance of Vega libraryparseConfig- Options to be passed to the Vega's parse methodviewConfig- Options to be passed ot the Vega's View constructor
All Vega specs are pre-populated with the following template. Your Vega graph may use any of the signals and the projection directly without declaring them, just like you use width or height signals.
{
  "padding": 0,
  "autosize": "none",

  // If true, graph will be repainted only after the map has finished moving
  // When false, map move is not as smooth, but it allows some visual elements
  // to stay in one place - such as the legend.
  "delayRepaint": true,

  // These signals are two-way bound with Leaflet
  // A vega spec may alter the declaration to update signal's value when needed
  // For example, your spec may override zoom/lat/long definition to control map's position:
  //    {"name": "zoom", "on": ..., "update": ...}
  "signals": [
    {"name": "zoom"},
    {"name": "latitude"},
    {"name": "longitude"}
  ],

  // For convenience, a preset projection is provided
  "projections": [
    {
      "name": "projection",
      "type": "mercator",
      // 256 is the tile size in pixels. The world's width is (256 * 2^zoom)
      // d3 mercator scaling is (world / 2 / PI)
      "scale": {"signal": "256*pow(2,zoom)/2/PI"},
      "rotate": [{"signal": "-longitude"}, 0, 0],
      "center": [0, {"signal": "latitude"}],
      "translate": [{"signal": "width/2"}, {"signal": "height/2"}]
    }
  ]
}