In this repository I collect my scripts to monitor $HIVE tokens. See also here: https://peakd.com/hive-122315/@achimmertens/how-i-have-set-up-elasticsearch-and-kibana-on-my-raspberry-pi-to-monitor-token-activities and here: https://peakd.com/hive-167922/@achimmertens/do-you-want-to-see-statistics-of-your-favorite-hive-token
Last updated by Achim Mertens, 2021/05/26
Hello together,
as you may know, now I am able to observe some token transactions. Here are some examples: $BEER, $POB, $LIST and $CHARY.
In this article I write how I did it. Content:
- Set up Raspberry Pi
- Installation of Docker
- Installatipon of Elasticsearch
- Installation of Kibana
- What is with Logstash
- Uploading Data to Elasticsearch via Script
- Preparing Kibana
- Sum Up
First, I had set up my Raspberry Pi.
I did the following steps 1:1 from https://www.shellhacks.com/raspberry-pi-docker-install-docker-on-raspberry-pi/
curl -fsSL https://download.docker.com/linux/raspbian/gpg | sudo apt-key add - echo "deb [arch=armhf] https://download.docker.com/linux/raspbian $(lsb_release -cs) stable" | sudo tee /etc/apt/sources.list.d/docker-ce.list sudo apt-get update sudo apt-get install docker-ce sudo pip3 install docker-compose sudo systemctl start docker sudo docker run hello-world sudo systemctl enable docker sudo usermod -aG docker $USER
Install the docker image:
pi@raspberrypi:~ $ docker run comworkio/elasticsearch:latest-arm Unable to find image 'comworkio/elasticsearch:latest-arm' locally latest-arm: Pulling from comworkio/elasticsearch c06905228d4f: Extracting [===========> ] 5.046MB/22.71MB 46cbc764dfc9: Download complete
…
Stop it via 2*strg-c
Show, if it was installed:
pi@raspberrypi:~ $ docker images REPOSITORY TAG IMAGE ID CREATED SIZE comworkio/elasticsearch latest-arm bf70c7ec0bb5 3 weeks ago 1.18GB
Start it again with the right parameters:
docker run -p 9200:9200 -p 9300:9300 -e "discovery.type=single-node" comworkio/elasticsearch:latest-arm
better:
docker run -v /home/pi/elk/elasticsearch.yml:/usr/share/elasticsearch/config/elasticsearch.yml --name elasti -p 9200:9200 -p 9300:9300 comworkio/elasticsearch:latest-arm
The content of elasticsearch.yml is:
http.cors.enabled : true
http.cors.allow-origin: "*"
http.cors.allow-methods: OPTIONS, HEAD, GET, POST, PUT, DELETE
http.cors.allow-headers: X-Requested-With,X-Auth-Token,Content-Type,Content-Length
http.cors.allow-credentials: true
Check if it runs:
pi@raspberrypi:
/chary $ curl -4 localhost:9200 { "name" : "elasticsearch", "cluster_name" : "elasticsearch", "cluster_uuid" : "fNPI3eJeR9qUJy6A_sZfuA", "version" : { "number" : "7.10.2", "build_flavor" : "default", "build_type" : "tar", "build_hash" : "747e1cc71def077253878a59143c1f785afa92b9", "build_date" : "2021-01-13T00:42:12.435326Z", "build_snapshot" : false, "lucene_version" : "8.7.0", "minimum_wire_compatibility_version" : "6.8.0", "minimum_index_compatibility_version" : "6.0.0-beta1" }, "tagline" : "You Know, for Search" } pi@raspberrypi:/chary $ netstat -na | grep 9200 tcp 0 0 0.0.0.0:9200 0.0.0.0:* LISTEN tcp 0 0 127.0.0.1:34124 127.0.0.1:9200 VERBUNDEN
See also: https://gitlab.comwork.io/oss/elasticstack/elasticstack-arm https://www.elastic.co/guide/en/elasticsearch/reference/current/docker.html
One can install kibana via docker with this command:
docker pull comworkio/kibana:latest-arm
But i didn't test it, because I already had kibana installed without container. I did it like this:
Download the Kibana Debian package from Elastic’s repository.
wget https://artifacts.elastic.co/downloads/kibana/kibana-7.7.0-amd64.deb
Install the downloaded package using the dpkg package installer.
sudo dpkg -i --force-all kibana-7.7.0-amd64.deb
Move the redistributed NodeJS to another folder (or delete it completely) and create a new empty directory node in the Kibana installation directory.
sudo mv /usr/share/kibana/node /usr/share/kibana/node.OLD sudo mkdir /usr/share/kibana/node
Next, download version 10.19.0 of NodeJS. This is the required version of NodeJS for Kibana 7.7.0. If you are installing another version of Kibana, you may want to check what NodeJS version it requires. The best way to do that is to start the Kibana service and it will tell you.
sudo wget https://nodejs.org/download/release/v10.19.0/node-v10.19.0-linux-armv7l.tar.xz
Unpack the TAR and move the content to the node directory under the Kibana installation directory.
sudo tar -xJvf node-v10.19.0-linux-armv7l.tar.xz pi@raspberrypi:/etc/kibana $ sudo mv ./node-v10.19.0-linux-armv7l/* /usr/share/kibana/node
(You may also want to create symlinks for the NodeJS executable and its tools. sudo ln -s /usr/share/kibana/node/bin/node /usr/bin/node sudo ln -s /usr/share/kibana/node/bin/npm /usr/bin/npm sudo ln -s /usr/share/kibana/node/bin/npx /usr/bin/npx)
Configure Kibana to accept requests on any IP address on the device.
pi@raspberrypi:/etc/kibana $ sudo cp kibana.yml kibana.yml_orig sudo vi /etc/kibana/kibana.yml
Set the server.host
setting to 0.0.0.0 like this: server.host: "0.0.0.0"
You can run Kibana with:
sudo service kibana start
Access the kibana GUI via your browser: http://192.168.2.121:/5601
You should see something like this:

See also: Docker: https://gitlab.comwork.io/oss/elasticstack/elasticstack-arm
Kibana installation: https://www.elastic.co/guide/en/kibana/current/deb.html#install-deb https://logz.io/blog/elk-stack-raspberry-pi/ https://gist.github.com/vjm/d206171be8971294f98b https://www.thepolyglotdeveloper.com/2018/03/install-nodejs-raspberry-pi-zero-w-nodesource/ https://github.com/nodesource/distributions/blob/master/README.md#debinstall elastic/kibana#3213 https://toddysm.com/2020/06/09/learn-more-about-your-home-network-with-elastic-siem-part-1-setting-up-elastic-siem/
Usually the three tools Elasticsearch, Logstash and Kibana (ELK) are used together. Logstash collects the logfiles and prepares them for Elasticsearch, which is a database, that can be fed and read out via port 9200. Kibana is the Graphical User Interface (GUI) for Elasticsearch. I have established such a system on Amazon Web Services (AWS), as described here. But with the Raspberry Pi Logstash doesn't work. Raspberry has an ARM-processor and the newest versions of logstash are not supported for ARM. I couldn't find any version that works, even with docker. So at the end, I gave it up and tried to find a workaround. And, hey, it works. I am very proud of myself. I managed to write a script, which delivers data in a form, that I can upload directly into Elasticsearch. Here we go:
This script collects data from the web API https://api.hive-engine.com/rpc/contracts. This is a kind of bank statement. Not very human readable. It looks like this:
{"jsonrpc":"2.0","id":1,"result":[{"_id":1021421,"type":"buy","buyer":"brutalmonkey","seller":"adityajainxds","symbol":"CHARY","quantity":"1.000","price":"0.07000000","timestamp":1620084681,"volume":"0.07000000","buyTxId":"e7ea5d64afa2cf550bc25158fb53905edcaca975","sellTxId":"6cf1271d5e553b55d4be04e208c77afd2212d7c8"}, ...
Then the script converts the data into json format, which is readable by Elasticsearch. It looks like this:
{"index": {"_index":"chary","_id":"1021421"}} {"id":1021421,"type":"buy","buyer":"brutalmonkey","seller":"adityajainxds","symbol":"CHARY","quantity":"1.000","price":"0.07000000","timestamp":1620084681,"volume":"0.07000000","buyTxId":"e7ea5d64afa2cf550bc25158fb53905edcaca975","sellTxId":"6cf1271d5e553b55d4be04e208c77afd2212d7c8"}
The "_index"-field is important, because with this, the dataset is pumped into the right database "chary". Setting the "_id"-field gives us the opportunity to import the data unique. This means, if a dataset is double (this happens in the log files or when you run the script more than once a day), only one dataset (the last) is taken and we don't have double entries.
And then the script pumps via bulkload this data into Elasticsearch, where it can be interpreted and graphically represented via Kibana.
#!/bin/sh #This script collects data from the hive-engine API and puts them into kibana #Written by Achim Mertens in April 2021 #Follow me on https://peakd.com/@achimmertens #Please create, if not exist, the folder /home/pi/elk/$TOKEN/log. I.e.: #mkdir /home/pi/elk/chary/log #Set some variables: TOKEN="chary" echo "Token = "$TOKEN DATE=
date -Iecho "DATE = "$DATE LOGPATH="/home/pi/elk/$TOKEN/log" echo "LOGPATH = "$LOGPATH LOG="$LOGPATH/$TOKEN""curl.log" echo "LOG = "$LOG LOG1="$LOGPATH/$TOKEN""curl1.log" echo "LOG1 = "$LOG1 LOG2="$LOGPATH/$TOKEN""curl2.log" echo "LOG2 = "$LOG2 LOG3="$LOGPATH/$TOKEN""curl3.log" echo "LOG3 = "$LOG3 LOGDATE="$LOGPATH/$TOKEN""curl_$DATE.log" echo "LOGDATE = "$LOGDATE LOGCONS="$LOGPATH/$TOKEN""curlcons.log" echo "LOGCONS = "$LOGCONS LOGCONSUNIQTEMP="$LOGPATH/$TOKEN""curlconsuniqtemp.log" echo "LOGCONSUNIQ = "$LOGCONSUNIQTEMP LOGCONSUNIQ="$LOGPATH/$TOKEN""curlconsuniq.log" echo "LOGCONSUNIQ = "$LOGCONSUNIQ INDEXLOG="$LOGPATH/$TOKEN"_ids.log echo "INDEXLOG = "$INDEXLOG INDEXLOG2="$LOGPATH/$TOKEN"_ids2.log echo "INDEXLOG2 = "$INDEXLOG2 INDEXLOG3="$LOGPATH/$TOKEN"_ids3.log echo "INDEXLOG3 = "$INDEXLOG3 #Get json file from api engine: curl -XPOST -H "Content-type: application/json" -d '{ "jsonrpc": "2.0", "method": "find", "params": { "contract": "market", "table": "tradesHistory", "query": { "symbol": "CHARY"}, "limit":1000, "offset": 0 }, "id": 1 }' 'https://api.hive-engine.com/rpc/contracts' > $LOG cat$LOG | sed -r 's/^.{34}//' | sed 's/.{3}$ //' > $LOG1 # delete the first 34 and the last 3 characters sed s/_id/id/g $LOG1 | sed s/},{"id"/={"id"/g | tr "=" "\n" > $LOG2 # exchange "id" and insert newlines sed s/$/}/g $LOG2 > $LOG3 # Append } at the end of each line #By extracting the IDs and setting it to the field "_id", we make sure, that all entires are unique: cat $LOG3 | awk -F':' '{print $2}'| awk -F',' '{print $1}' | grep -v index > $INDEXLOG # Extrahiere IDs cat $INDEXLOG | awk '{print "{"index": {"_index":"chary","_id":"" $1 ""}}="'} > $INDEXLOG2 # Füge Text ein paste $INDEXLOG2 $LOG3 > $INDEXLOG3 sed s/=/=/g $INDEXLOG3 | tr "=" "\n" > $LOGDATE # Ersetze "=" durch Cariege Return cat $LOGDATE >> $LOGCONS # Sammle die Daten in einem Topf #Upload the complete json data into kibana: curl --location --request POST 'http://localhost:9200/chary/_bulk?' --header 'Content-Type: application/json' --data-binary @$LOGDATE
(It was a bit changed in the markup language, so I created this screenshot):

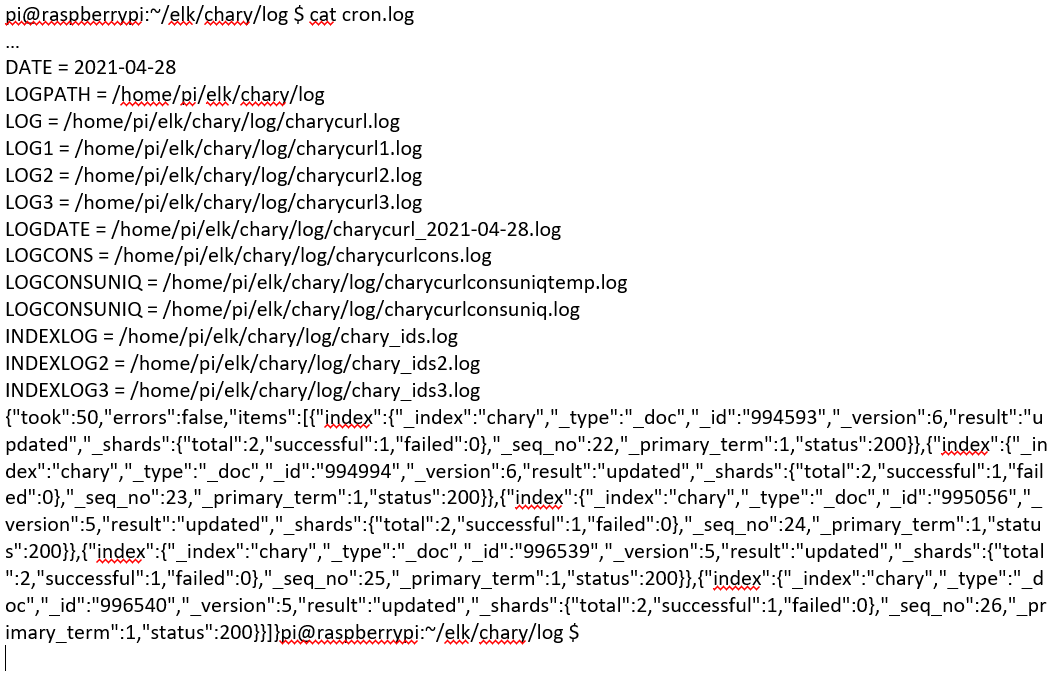
After executing it looks like this:

Now this script has to run regularely. This is done with crontab. Meanwhile I have several scripts. They start every morning at 4:50, 4:51, 4:52,...:
crontab -e
49 4 * * Sat date > /var/www/html/elk/index.html 2>>/home/pi/elk/index_cron.log 51 4 * * * /home/pi/elk/beer/beercurl_json.sh >> /home/pi/elk/beer/log/cron.log 52 4 * * * /home/pi/elk/chary/charycurl_json.sh >> /home/pi/elk/chary/log/cron.log 53 4 * * * /home/pi/elk/pob/pobcurl_json.sh >> /home/pi/elk/pob/log/cron.log 54 4 * * * /home/pi/elk/list/listcurl_json.sh >> /home/pi/elk/list/log/cron.log 55 4 * * * /home/pi/elk/leo/leocurl_json.sh >> /home/pi/elk/leo/log/cron.log 56 4 * * * /home/pi/elk/sim/simcurl_json.sh >> /home/pi/elk/sim/log/cron.log 57 4 * * * /home/pi/elk/beer/botcurl_json.sh >> /home/pi/elk/beer/logbot/cron.log 58 4 * * * /home/pi/elk/spt/sptcurl_json.sh >> /home/pi/elk/spt/log/cron.log 05 5 * * * /home/pi/elk/chary/dollarchary.sh >> /home/pi/elk/chary/log/cron.log 06 5 * * * /home/pi/elk/beer/dollarbeer.sh >> /home/pi/elk/beer/log/cron.log 05 5 * * * /home/pi/elk/leo/dollarleo.sh >> /home/pi/elk/leo/log/cron.log 05 5 * * * /home/pi/elk/list/dollarlist.sh >> /home/pi/elk/list/log/cron.log 05 5 * * * /home/pi/elk/pob/dollarpob.sh >> /home/pi/elk/pob/log/cron.log 05 5 * * * /home/pi/elk/sim/dollarsim.sh >> /home/pi/elk/sim/log/cron.log 05 5 * * * /home/pi/elk/spt/dollarspt.sh >> /home/pi/elk/spt/log/cron.log
A cron.log looks like this:
Now the first bulkload was done to Elasticsearch/Kibana. One can test it via port 9200 (Elasticsearch):
http://192.168.2.121:9200/chary
The result should look like this:

Here is the first data set:
http://192.168.2.121:9200/chary/_search

In Kibana we now have the hen-egg problem. We need a proper index with a proper mapping, which we don't have at the beginning. The easiest way is to import the first bulkload, which gives us a rough mapping. Then we can copy the index, delete, paste and modify it, and put it back. This can be done with the dev-tools of kibana:

In Kibana (port 5601), we have to create an index pattern, based on the index "chary", which was created during the bulk load. We need this pattern for creating our reports. This is set up easy via "Create index pattern" and choosing the timestamp:

Now we should be able to see our first results (maybe you have to import once again, because after deleting the index, all data disapears). Go to discover, choose your index pattern and be aware of the right timeframe:

Now we can start with preparing our figures. Go to visualize and create your first visualization:

It took me several month (with about 5 hours peer week) to come here. For me it was a walk through a djungle maze with lot of swamps, where I got stuck, because I started with nothing but some basic know how. But I had some clear goals: I wanted to understand how API works, how ELK works and to create a report for my $CHARY token. I need this knowledge also for my job. Now I am not an expert, but I understand the basic concepts. And I have reached my goal. This is a cool feeling.

In the next days I want to show you, what I do, if someone asks "Can you also monitor the XYZ token?" If you have questions, please ask me.
Regards, Achim
Hello Hivers, Hello token traders, Hello others,
in this post I want to show you, how I have set up the monitoring of tokens and how I can enhance this monitoring for an arbitrary HIVE-subtoken.
Content:
- Summary of setting up ELK on Raspberry Pi
- Explaining some data fields
- Enhancing the monitoring for other token
- My weekly or monthly service

I have installed Elasticsearch (database) via docker and Kibana (frontend) via normal setup on my Raspberry Pi. The challenge was Logstash, a tool that is used to collect and prepare data. It doesn't run in a new version on the ARM-based Raspberry Pi. So I created a linux bash script, which collects the data from its origin and turns it into a json format, which can be read by Elasticsearch. Now, the data from $BEER, $POB, $LIST and $CHARY is read daily and put into my Elasticsearch database automatecally.
You can see the details here.
The origin of the data is https://api.hive-engine.com/rpc/contracts When you try to open it via browser, you get an error, but when you open it in a shell with this comand:
curl -XPOST -H "Content-type: application/json" -d '{ "jsonrpc": "2.0", "method": "find", "params": { "contract": "market", "table": "tradesHistory", "query": { "symbol": "CHARY"}, "limit":1000, "offset": 0 }, "id": 1 }' 'https://api.hive-engine.com/rpc/contracts'
then you get a result like this:
{"jsonrpc":"2.0","id":1,"result":[{"_id":1025553,"type":"sell","buyer":"achimmertens","seller":"filotasriza3","symbol":"CHARY","quantity":"19.702","price":"0.02000000","timestamp":1620200553,"volume":"0.39404000","buyTxId":"afa1288767a88ceff32031fa7008f740bc93de2f","sellTxId":"e519ba622283fec26b7e1b6dee514efb82244d0d"},{"_id":1026344,"type":"sell","buyer":"achimmertens","seller":"elkezaksek","symbol":"CHARY","quantity":"711.122","price":"0.02000000","timestamp":1620227892,"volume":"14.22244000","buyTxId":"afa1288767a88ceff32031fa7008f740bc93de2f","sellTxId":"8c9d7d646c48d6e92bb5735a44a25c7dc698a30f"}, ... {"_id":1027082,"type":"sell","buyer":"achimmertens","seller":"jjprac","symbol":"CHARY","quantity":"32.433","price":"0.02000000","timestamp":1620242577,"volume":"0.64866000","buyTxId":"afa1288767a88ceff32031fa7008f740bc93de2f","sellTxId":"830110ae3a51fdc6ae111c78849a5c8434be0670"}]}
My magic script turns it into the following format:
{"index": {"_index":"chary","_id":"1025553"}} {"id":1025553,"type":"sell","buyer":"achimmertens","seller":"filotasriza3","symbol":"CHARY","quantity":"19.702","price":"0.02000000","timestamp":1620200553,"volume":"0.39404000","buyTxId":"afa1288767a88ceff32031fa7008f740bc93de2f","sellTxId":"e519ba622283fec26b7e1b6dee514efb82244d0d"}
One can see the fields and its content. This means: On 1620200553 (Unix time format = GMT: Wednesday, 5. May 2021 07:42:33), the seller "filotaria3" sold 19,702 $CHARY to the buyer "achimmertens", who paid 0,394 $HIVE for it. This is a price of 0.02 $HIVE/$CHARY.
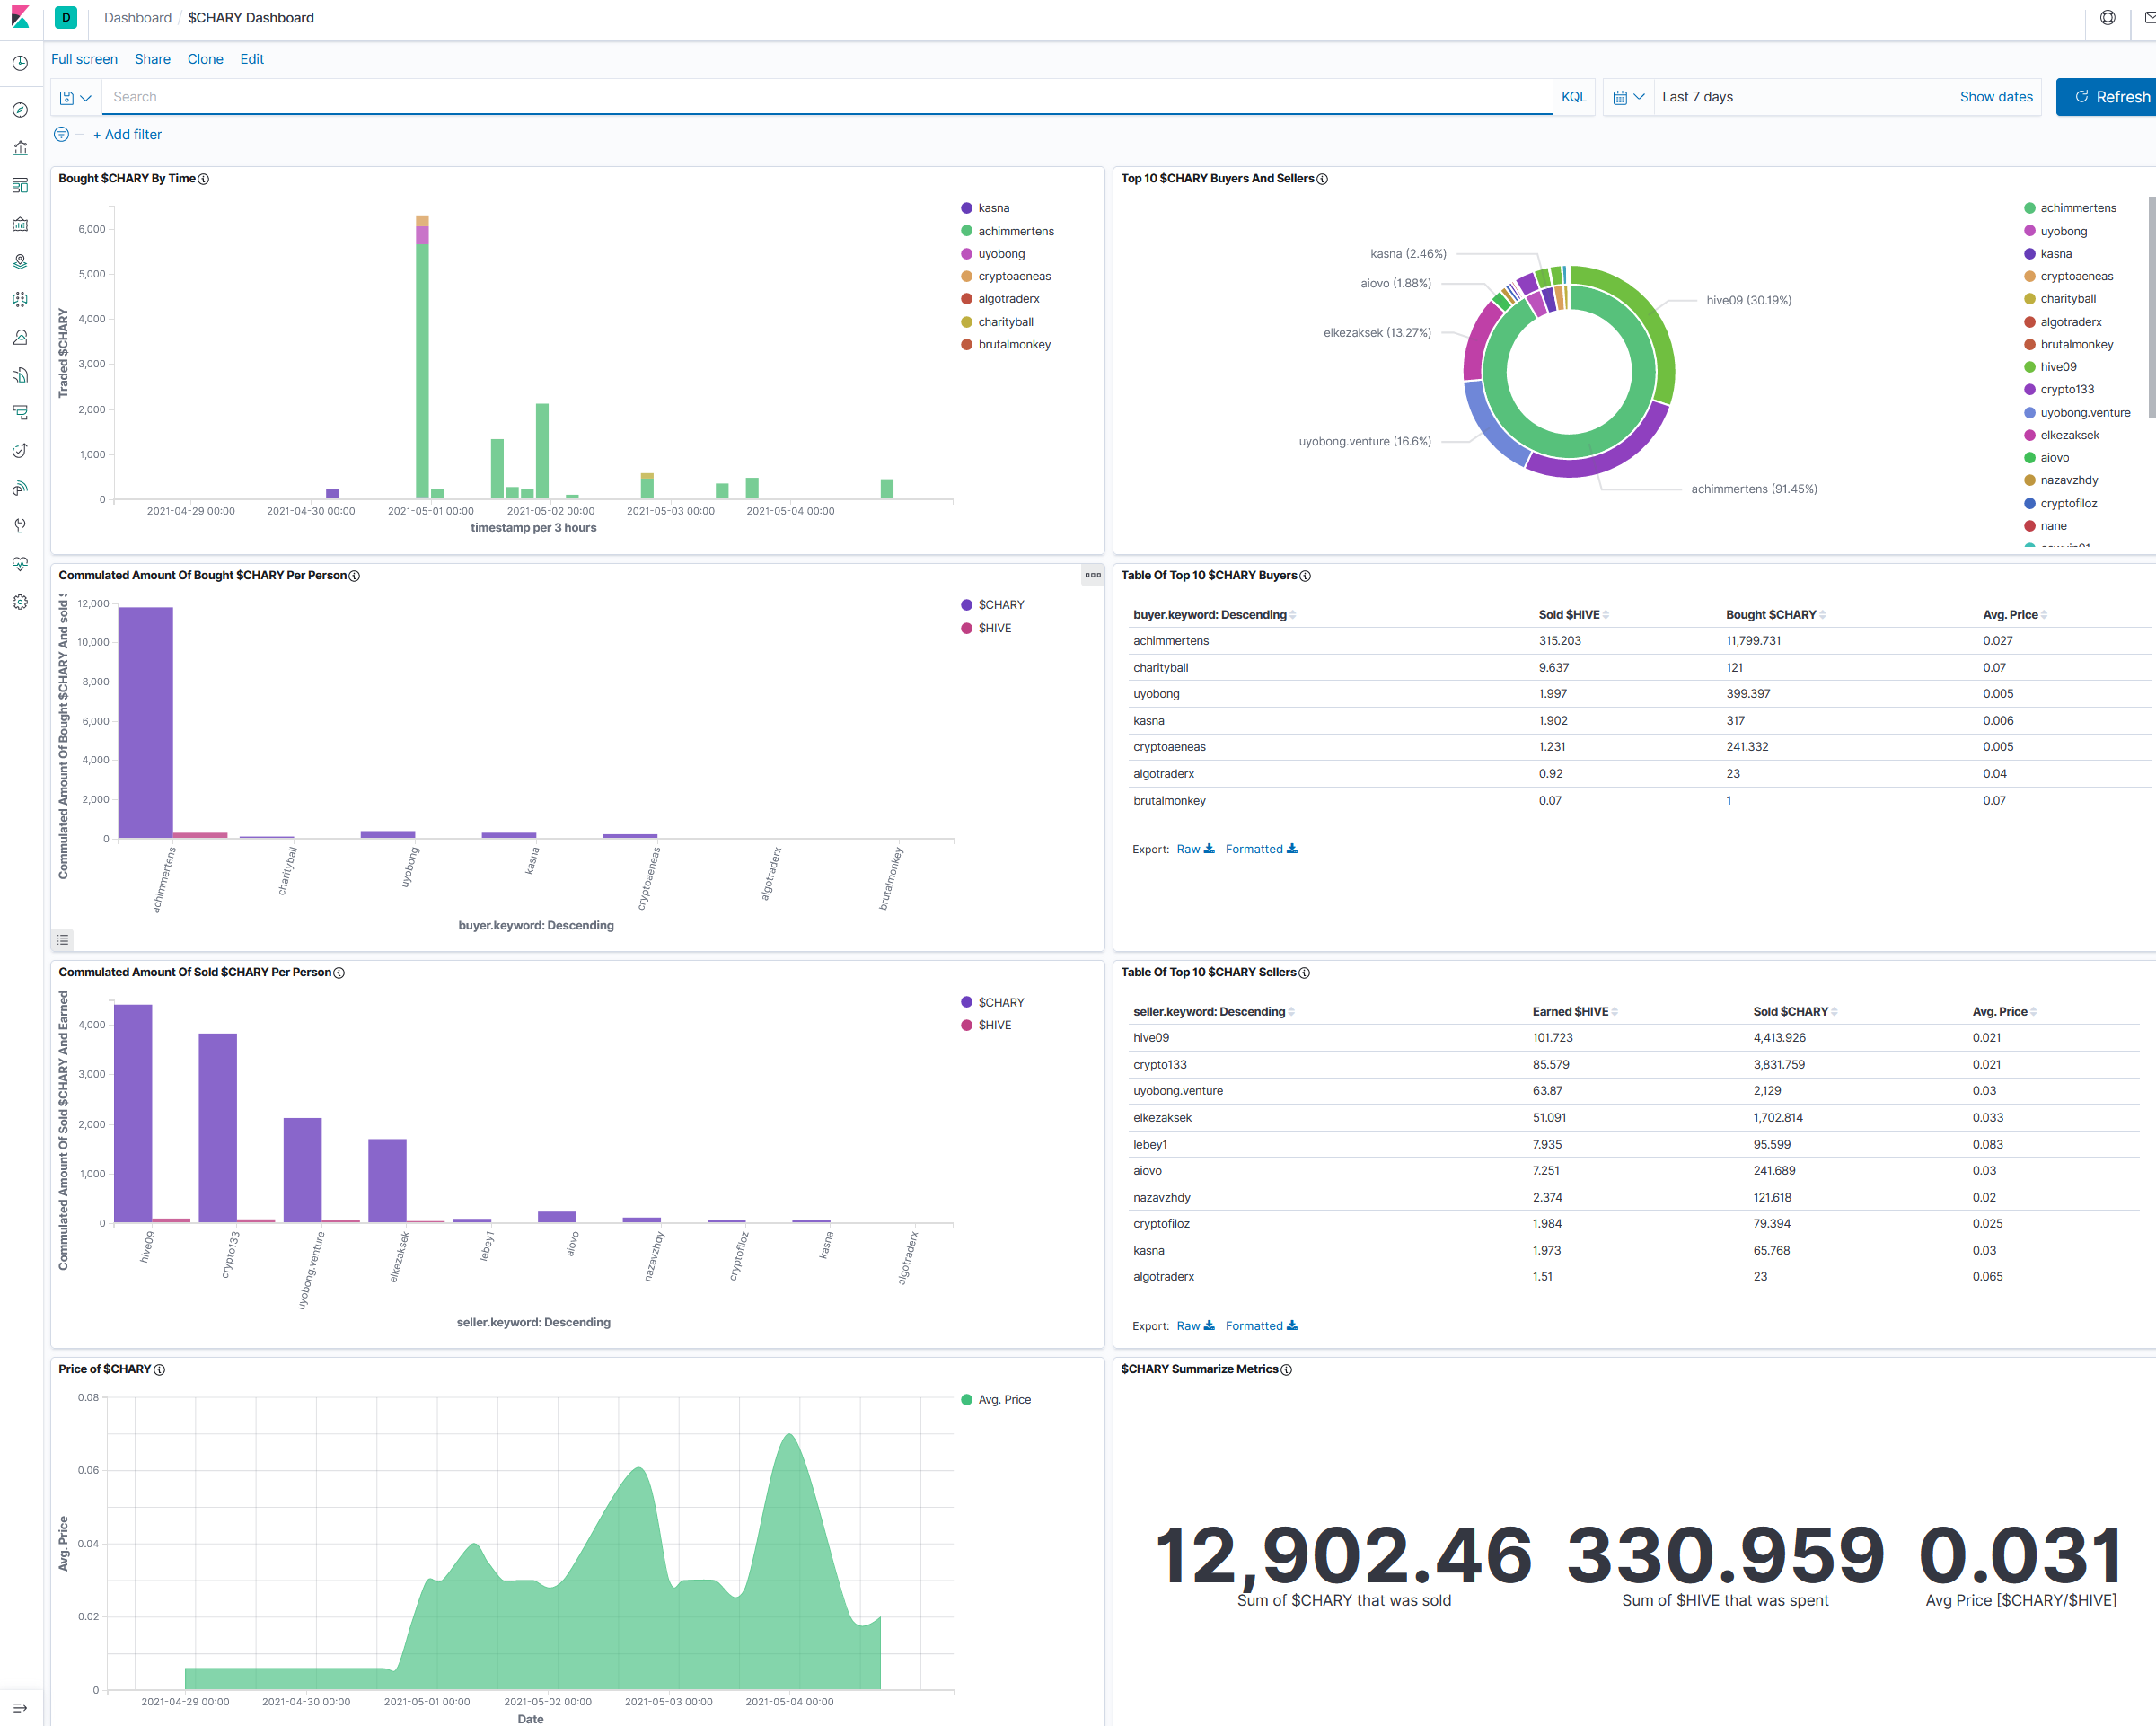
These buy events are now collected in Elasticsearch and in Kibana it looks like this:

Now I am able to interprete these data in several ways. For example like this:
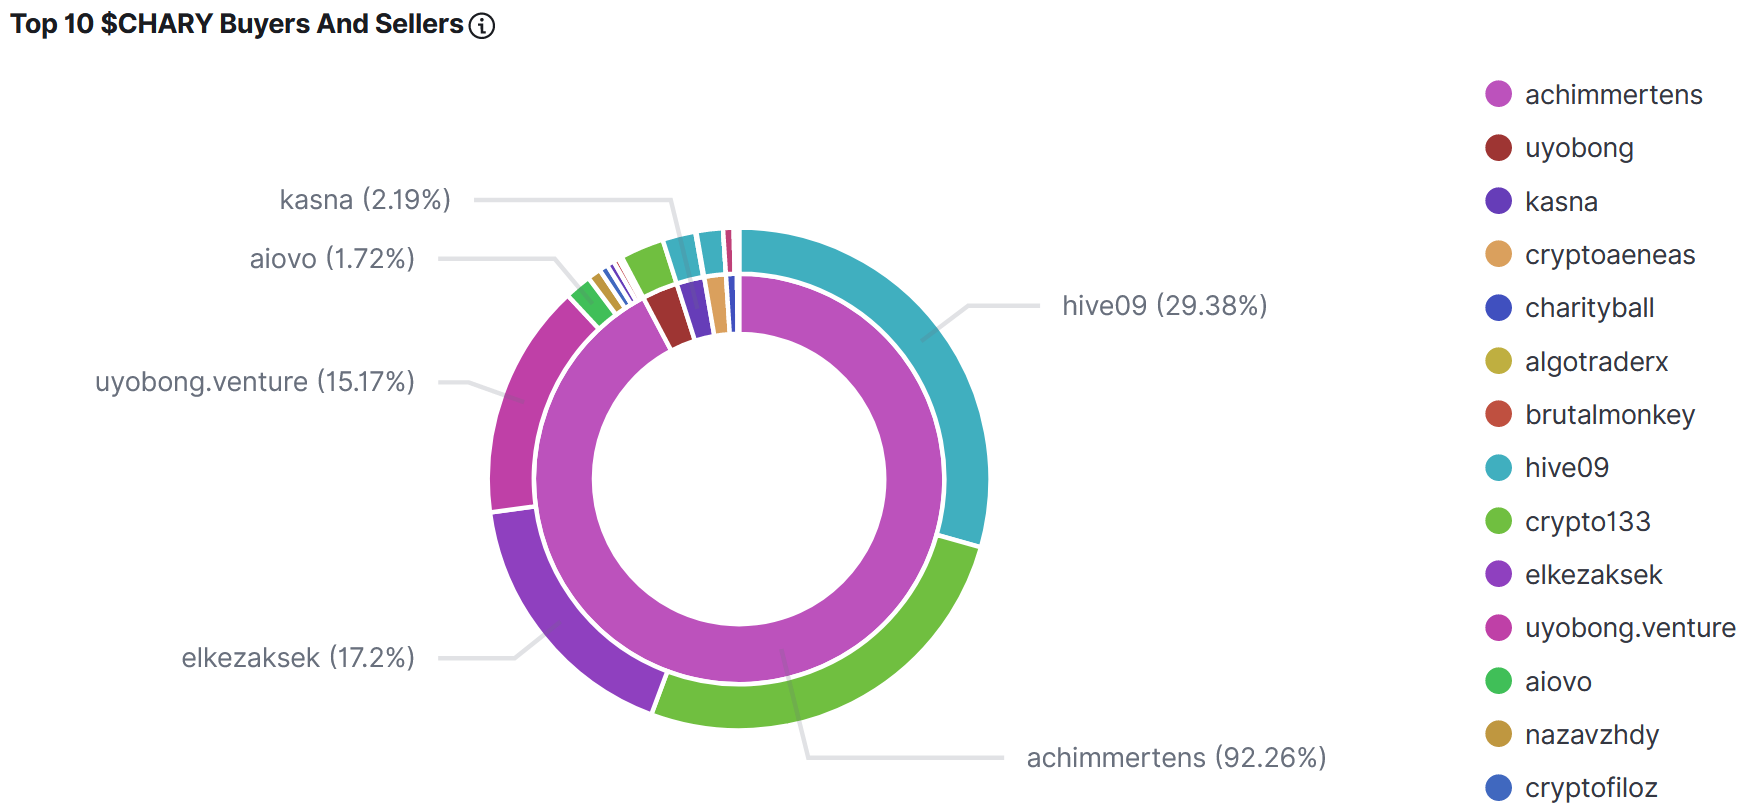 The inside of the circle shows the Buyers of $CHARY, ordered by $HIVE they have spent. The outside shows the recipients of that $HIVE (Sellers of $CHARY)
You can see further examples, as I already mentioned, here: $BEER, $POB, $LIST and $CHARY.
In this chapter I go more into details. It is a documentation for you, but mainly for me. You can skip it if you want :-)
- Create directories and copy files to it:
pi@raspberrypi:~ $ cd elk pi@raspberrypi:
/elk $ mkdir pob pi@raspberrypi:/elk $ mkdir pob/log pi@raspberrypi:/elk $ cp beer/beercurl_json.sh pob/pobcurl_json.sh pi@raspberrypi:/elk $ cd pob pi@raspberrypi:~/elk/pob $ ll insgesamt 16 drwxr-xr-x 3 pi pi 4096 Apr 30 07:00 . drwxr-xr-x 6 pi pi 4096 Apr 30 07:00 .. drwxr-xr-x 2 pi pi 4096 Apr 30 07:00 log -rwxr--r-- 1 pi pi 2269 Apr 30 07:00 pobcurl_json.sh
- Exchange everywhere (4 times) the tokenname:
pi@raspberrypi:~/elk/pob $ vi pobcurl_json.sh
- Insert the mapping into kibana:
PUT pob { "aliases" : { }, "mappings" : { "properties" : { "buyTxId" : { "type" : "text", "fields" : { "keyword" : { "type" : "keyword", "ignore_above" : 256 } } }, "buyer" : { "type" : "text", "fields" : { "keyword" : { "type" : "keyword", "ignore_above" : 256 } } }, "id" : { "type" : "long" }, "price" : { "type" : "float" }, "quantity" : { "type" : "float" }, "sellTxId" : { "type" : "text", "fields" : { "keyword" : { "type" : "keyword", "ignore_above" : 256 } } }, "seller" : { "type" : "text", "fields" : { "keyword" : { "type" : "keyword", "ignore_above" : 256 } } }, "symbol" : { "type" : "text", "fields" : { "keyword" : { "type" : "keyword", "ignore_above" : 256 } } }, "timestamp" : { "type" : "date", "format" : "epoch_second" }, "type" : { "type" : "text", "fields" : { "keyword" : { "type" : "keyword", "ignore_above" : 256 } } }, "volume" : { "type" : "float" } } } }
- Test it:
pi@raspberrypi:~/elk/pob $ ./pobcurl_json.sh
The result should look like this:
Token = pob DATE = 2021-04-30 LOGPATH = /home/pi/elk/pob/log LOG = /home/pi/elk/pob/log/pobcurl.log LOG1 = /home/pi/elk/pob/log/pobcurl1.log LOG2 = /home/pi/elk/pob/log/pobcurl2.log LOG3 = /home/pi/elk/pob/log/pobcurl3.log LOGDATE = /home/pi/elk/pob/log/pobcurl_2021-04-30.log LOGCONS = /home/pi/elk/pob/log/pobcurlcons.log INDEXLOG = /home/pi/elk/pob/log/pob_ids.log INDEXLOG2 = /home/pi/elk/pob/log/pob_ids2.log INDEXLOG3 = /home/pi/elk/pob/log/pob_ids3.log % Total % Received % Xferd Average Speed Time Time Time Current Dload Upload Total Spent Left Speed 100 42346 100 42181 100 165 113k 454 --:--:-- --:--:-- --:--:-- 113k {"took":611,"errors":false,"items":[{"index":{"_index":"pob","_type":"_doc","_id":"1006038","_version":1,"result":"created","_shards":{"total":2,"successful":1,"failed":0},"_seq_no":0,"_primary_term":1,"status":201}},{"index":{"_index":"pob","_type":"_doc","_id":"1006051","_version":1,"result":"created","_shards":{"total":2,"successful":1,"failed":0},"_seq_no":1,"_primary_term":1,"status":201}},{…
- Create Index pattern in kibana and check if the data can be seen in Kibana.
- Add the script to crontab:
crontab -e #m h dom mon dow command 50 4 * * * /home/pi/chary/charycurl.sh >> /home/pi/chary/cron.log 51 4 * * * /home/pi/elk/beer/beercurl_json.sh >> /home/pi/elk/beer/log/cron.log 52 4 * * * /home/pi/elk/chary/charycurl_json.sh >> /home/pi/elk/chary/log/cron.log 53 4 * * * /home/pi/elk/pob/pobcurl_json.sh >> /home/pi/elk/pob/log/cron.log
One can copy and paste all the visualizations in kibana. This saves much time, but is a bit tricky.
- At first we need the IDs of the index patterns. For this we go to Kibana/Dev Tools and type in:
GET .kibana/_search?q=type:index-pattern {}
Here are the results:
… { "_index" : ".kibana_1", "_type" : "_doc", "_id" : "index-pattern:a8c89ec0-a975-11eb-9d18-99c16040a3f4", "_score" : 5.0162334, "_source" : { "index-pattern" : { "title" : "list*", … { "_index" : ".kibana_1", "_type" : "_doc", "_id" : "index-pattern:251023c0-a973-11eb-9d18-99c16040a3f4", "_score" : 4.9639482, "_source" : { "index-pattern" : { "title" : "pob*", … { "_index" : ".kibana_1", "_type" : "_doc", "_id" : "index-pattern:62fff5f0-a9a2-11eb-9d18-99c16040a3f4", "_score" : 5.0162334, "_source" : { "index-pattern" : { "title" : "chary*", … { "_index" : ".kibana_1", "_type" : "_doc", "_id" : "index-pattern:db83d9b0-a722-11eb-9d18-99c16040a3f4", "_score" : 5.355957, "_source" : { "index-pattern" : { "title" : "beer*",

- Copy the existing view into a file via Management/saved objects and downloading the ndjson file for the corresponding views.

- Open the ndjson file with an editor (like notepad++).
- Delete the ID for the Visualition:
,"title":"Commulated Amount Of Sold $CHARY Per Person"}"},"id":"","migrationVersion":{"visualization":"7.7.0"},"references":
• Exchange the Reference ID to the Index-Patterns: Set the index pattern ID for your new token at "references" (In this case "251023c0-a973-11eb-9d18-99c16040a3f4" for the $POB token): … "migrationVersion":{"visualization":"7.7.0"},"references":[{"id":"251023c0-a973-11eb-9d18-99c16040a3f4","name":"kibanaSavedObjectMeta.searchSourceJSON.index","type":"index-pattern"}] …

• Exchange the Token Name everywhere

- Save and import the ndjson file

Now these visualizations appear under "Saved Object" and can be used in the dashboards. The dashboard can be copied and pasted in a similar way, but it is easier for me to create a new one and just add the views.
How to set up Kibana:
- Go to Kibana Dev-Mode
- Insert the content of put_alive.json and execute it.
- execute alivecurl_json.sh to fill some data into kibana
- Create an indexpattern for alive and use "alive_index_pattern_id" as the index_pattern_id name. Here is an example

- Edit tokenviews.ndsjon and replace the Ref-ID with the new Indexpattern-ID
- Import that file into Kibana and solve the conflict by chosing the new index in the drop down menu.
- Adjust if needed the new dashboard and the new views
So setting up a new token takes about one hour work for me (or less if I get more routine). To create a statistic post I can reuse texttemplates and exchange the tokenname. I have to take the 6 screenshots and paste it. The two tables are done via taking the raw data format and exchanging some characters in notepad++. All in all a regular stats posts takes about 15 minutes. I can offer to upload 5-6 stats per week (mostly fridays). At the moment it is $BEER, $POB and $LIST weekly and $CHARY monthly. I want to do this as long I have fun with it and see your votes and interests. If someone has an idea to automate it, please tell me.
If you see enhancements, hints, errors, ... please tell me also. If you want other token monitored, please tell me as well.
Regards, Achim