Home

Juicebox is visualization software for Hi-C experiments. Using Juicebox, you can
- visualize Hi-C maps by zooming in and out over many magnitudes of resolution in real time
- compare Hi-C maps with ENCODE tracks, genes, loops/domains, other Hi-C maps, & more
- explore a large archive of published Hi-C experiments
- load your own Hi-C data by creating your map using Juicer tools and opening it in Juicebox
- ...and more!
-
Start by downloading Juicebox for Windows, Mac, or simply the jar. Also available here.
-
Watch the video:
-
Once you've successfully launched Juicebox, click File→Open to load a new Hi-C map.
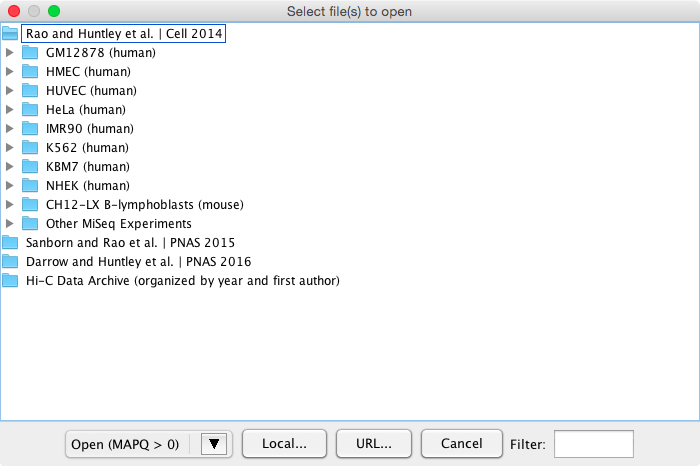
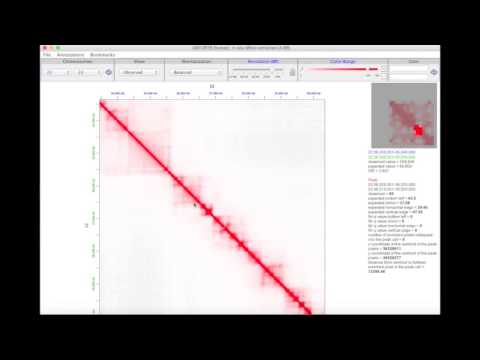
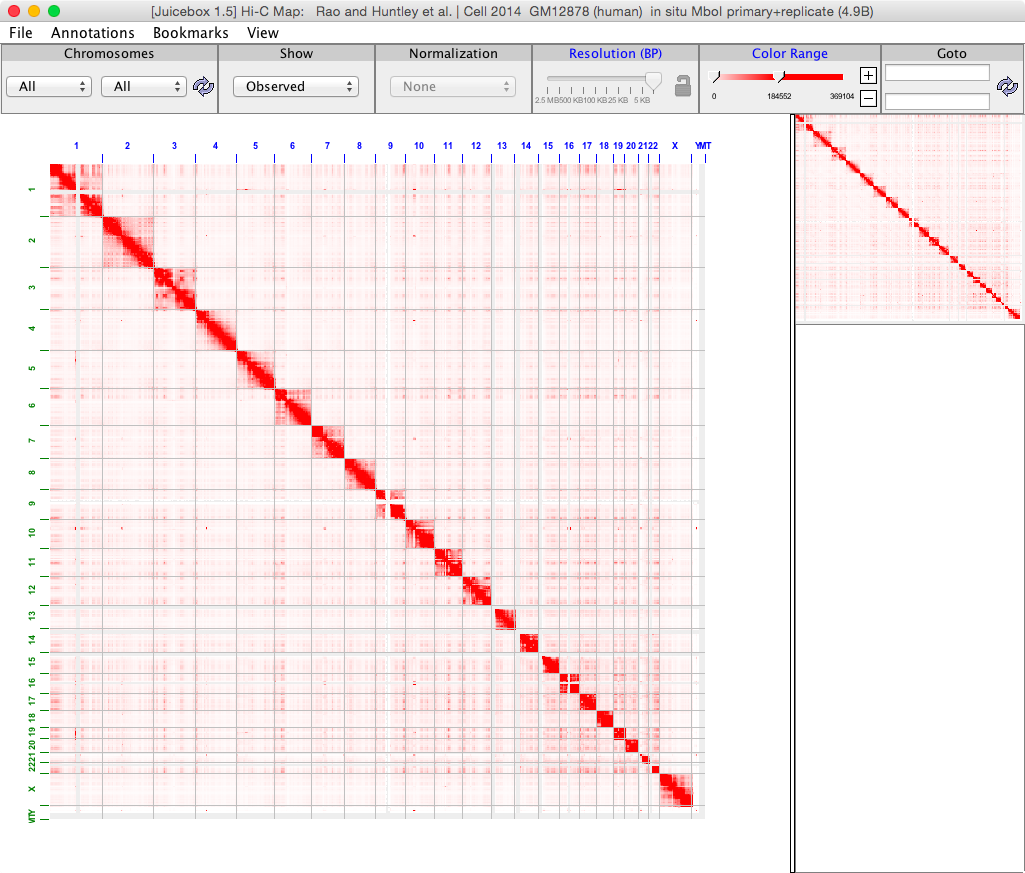
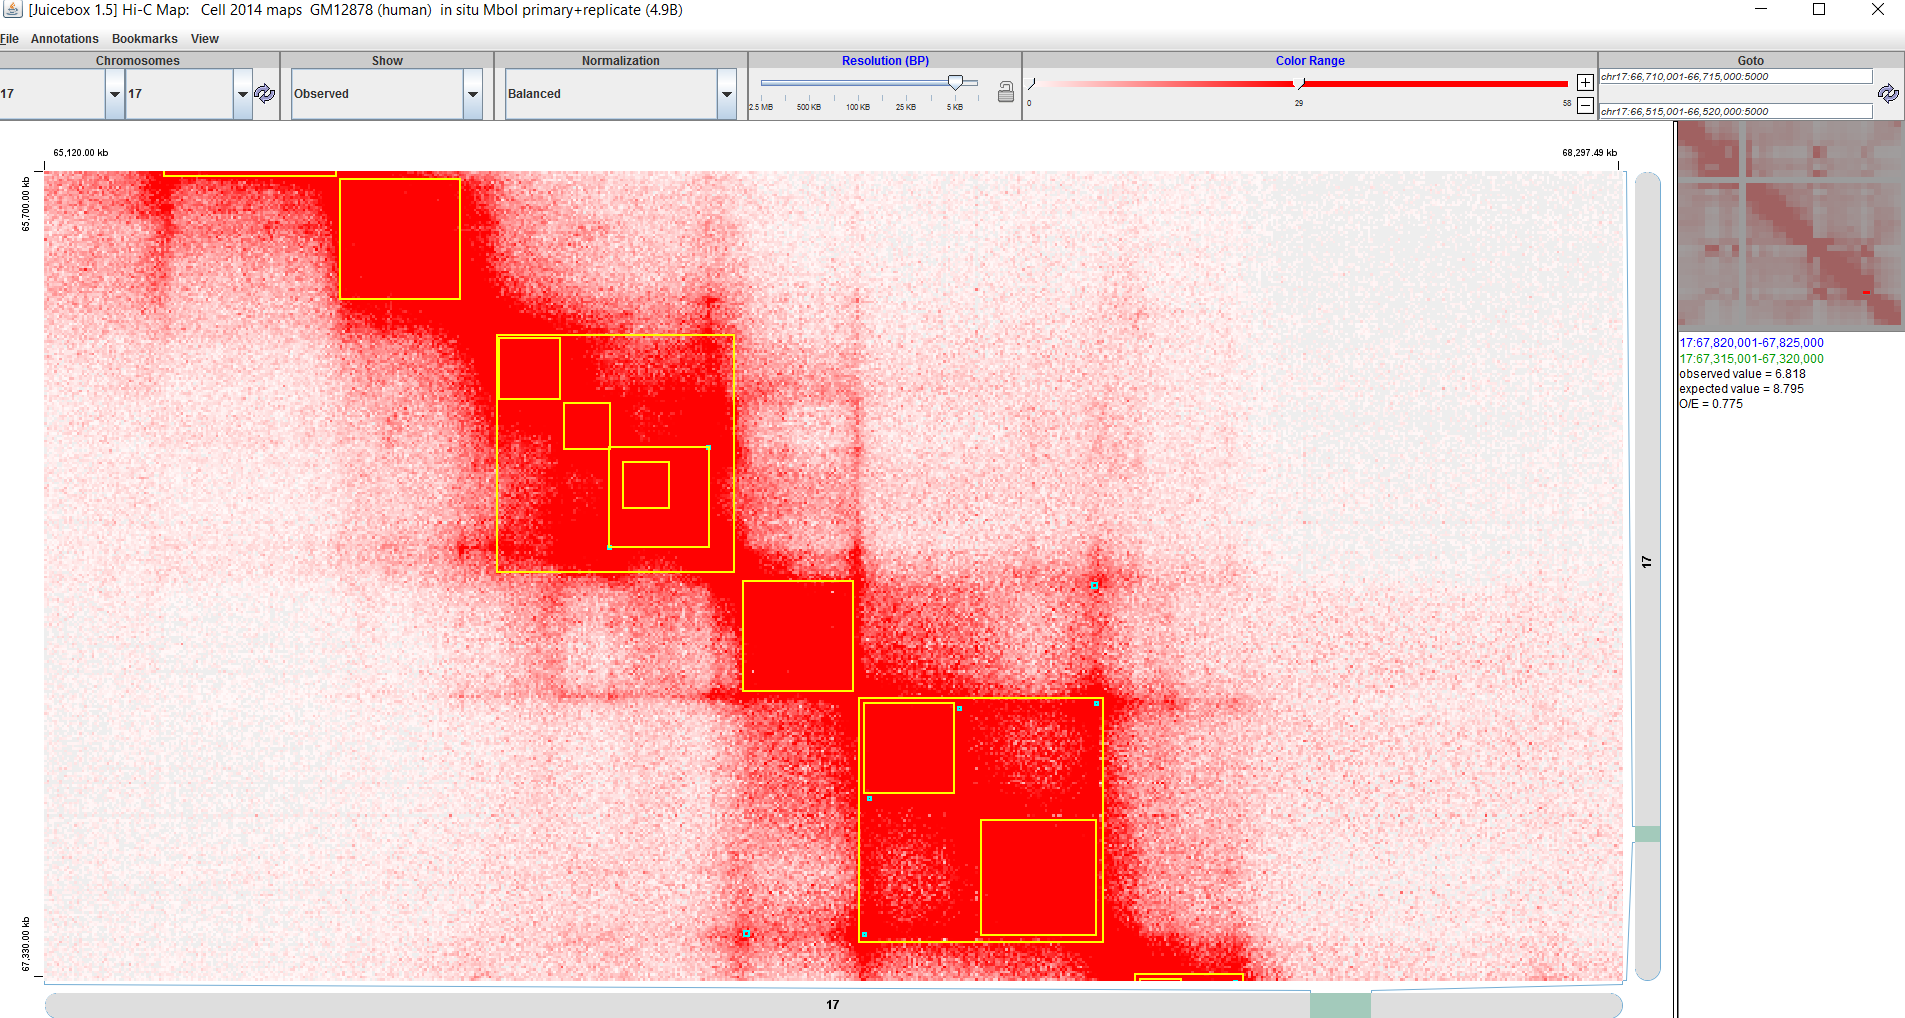
All of the Hi-C maps from our recent papers are available, as well as an archive of other published Hi-C experiments. Click Cell 2014→GM12878→in situ MboI→combined (4.9B) to open our largest map: the combined primary and replicate GM12878 library.
-
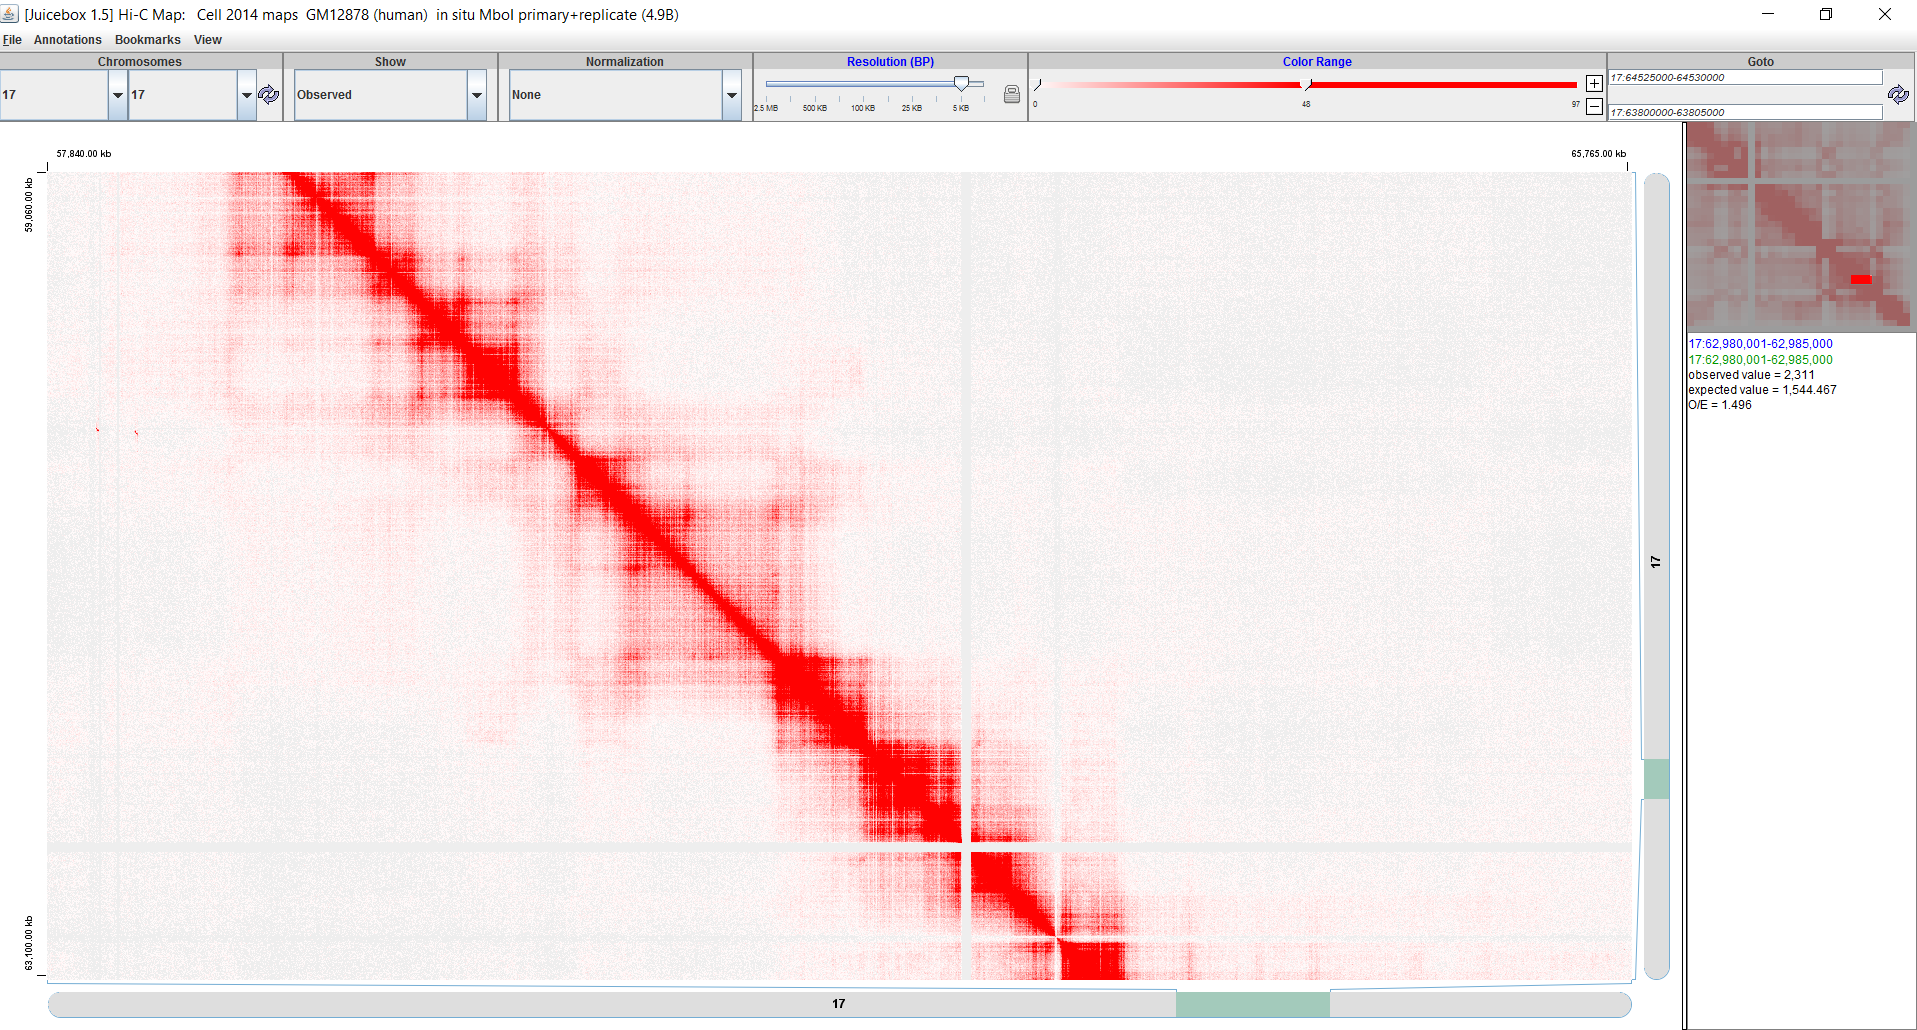
Click on chromosome 17. This can be done either by selecting 17 x 17 below the Chromosome section on the toolbar and hitting the refresh button, or by clicking on chromosome 17 itself. Using the selector below Normalization, change the normalization to Balanced. Slide the resolution slider to 5 KB.
-
Use your mouse to pan until your range is roughly 64,500 kb to 69,000 kb. Alternatively, in the Go panel, type 17:64500000-69000000 in both boxes and hit the refresh button.
-
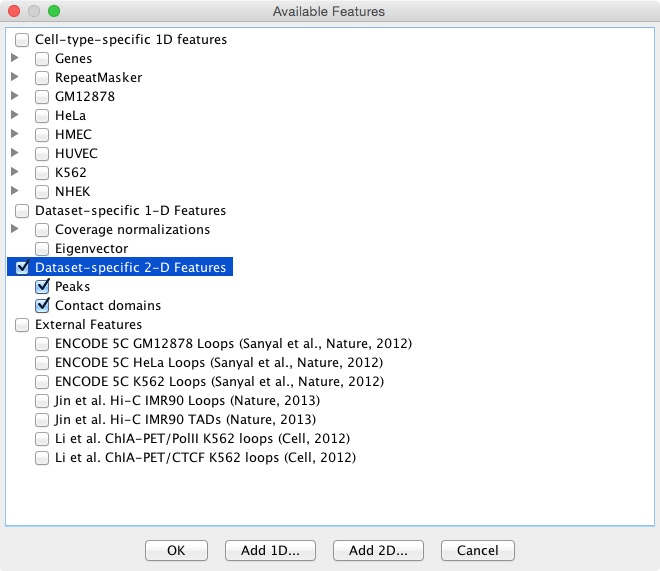
Now click Annotations in the menu bar and go to Load Basic Annotations. Select the Dataset Specific 2-D Features for this map.
-
You will see a series of yellow boxes and cyan points loaded. The cyan points denote the exact peaks.
-
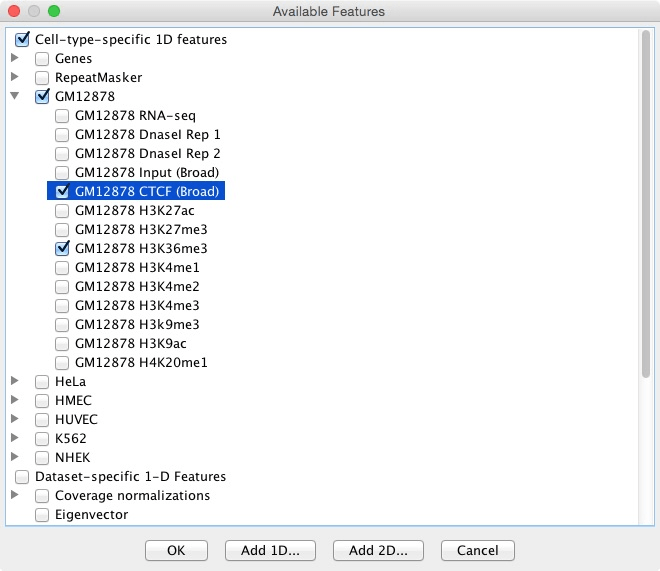
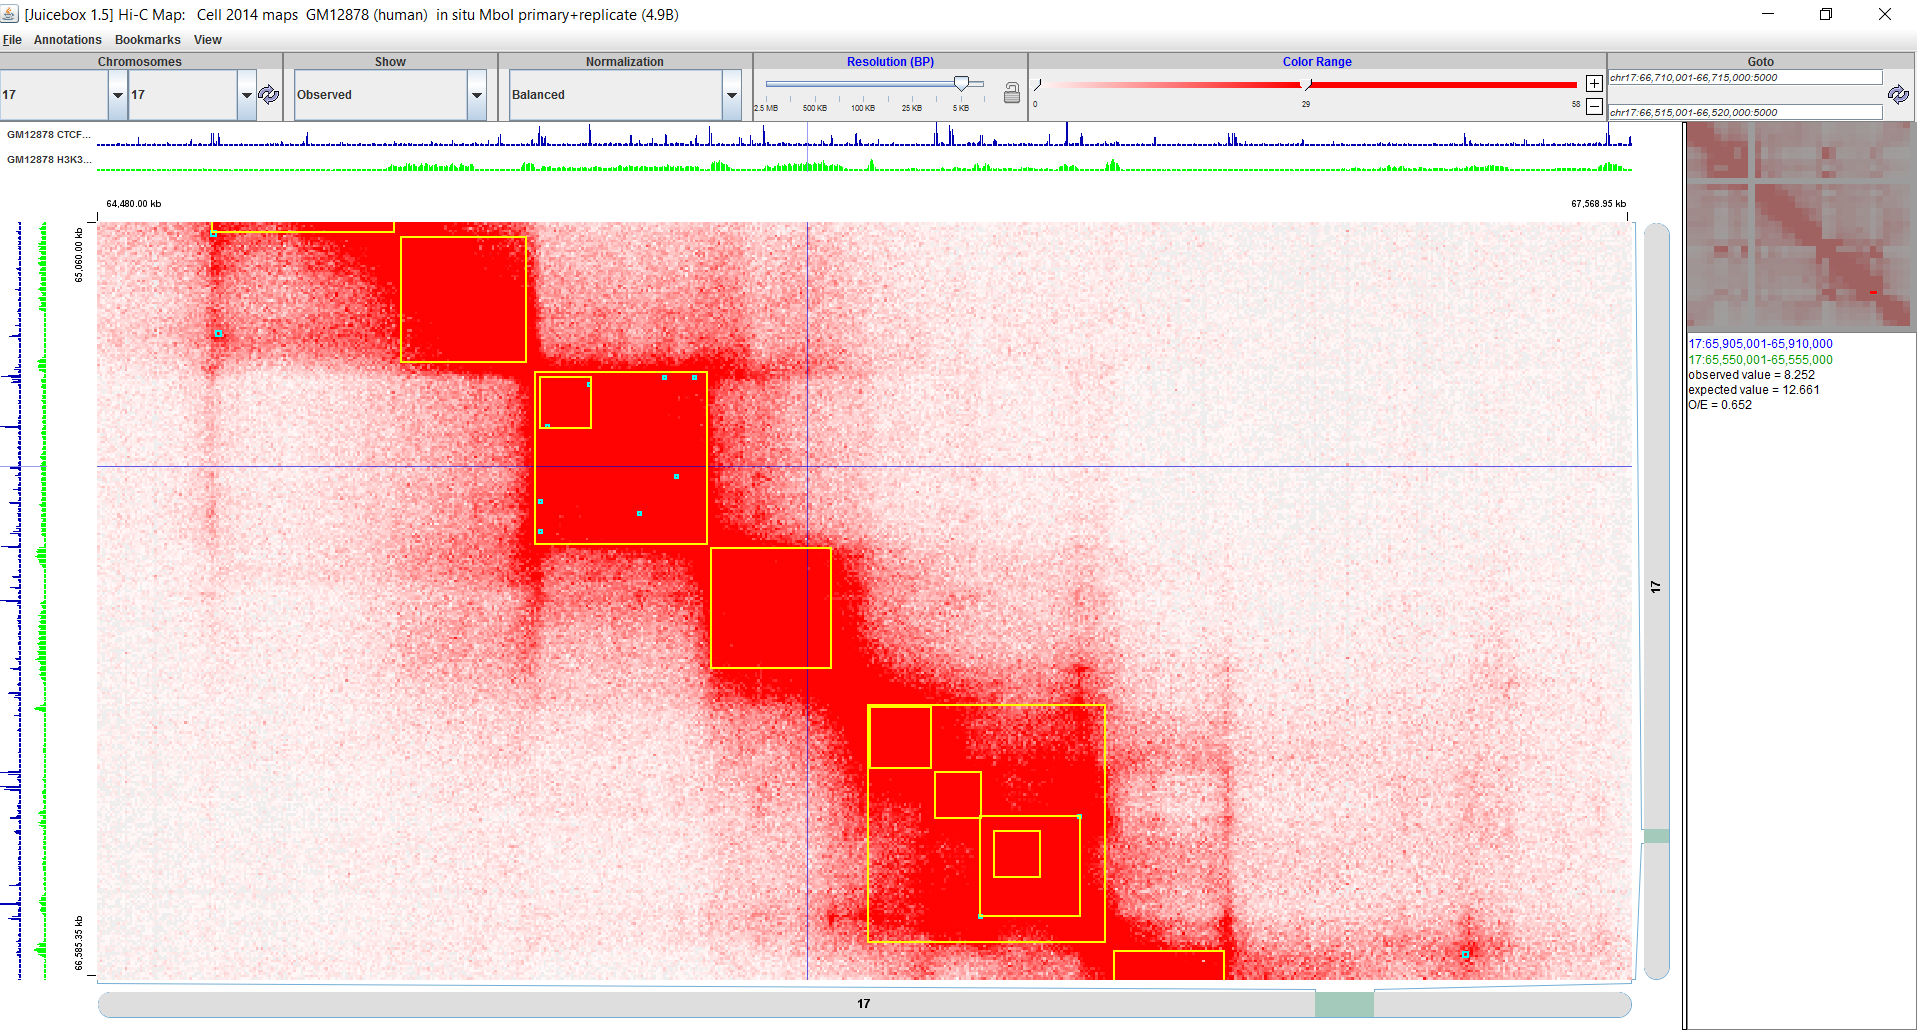
These are the contact domains and peaks that we found when analyzing this map. Now let's see what other annotations look like here. Go to the Annotations menu and click Load Basic Annotations again. Click on GM12878 and select the H3K36me3 track and the CTCF track.
-
You can line up what you see in the heat map with the tracks. Right click on the heat map and select Enable straight edge. Then move around on the map to see the features lined up with the tracks.
-
There are many more functions to explore in Juicebox -- enjoy! Or try our tutorial next.