To run the project locally make sure you have the Node installed.
to install the dependencies. open the terminal in project and
npm install
React, react-dom and styled-components are the only dependencies which used to build rich user interface.
To start the development server run:
npm run start
also, to run jest unit tests run:
npm run test
to check other existing commands please check out scripts block in package.json
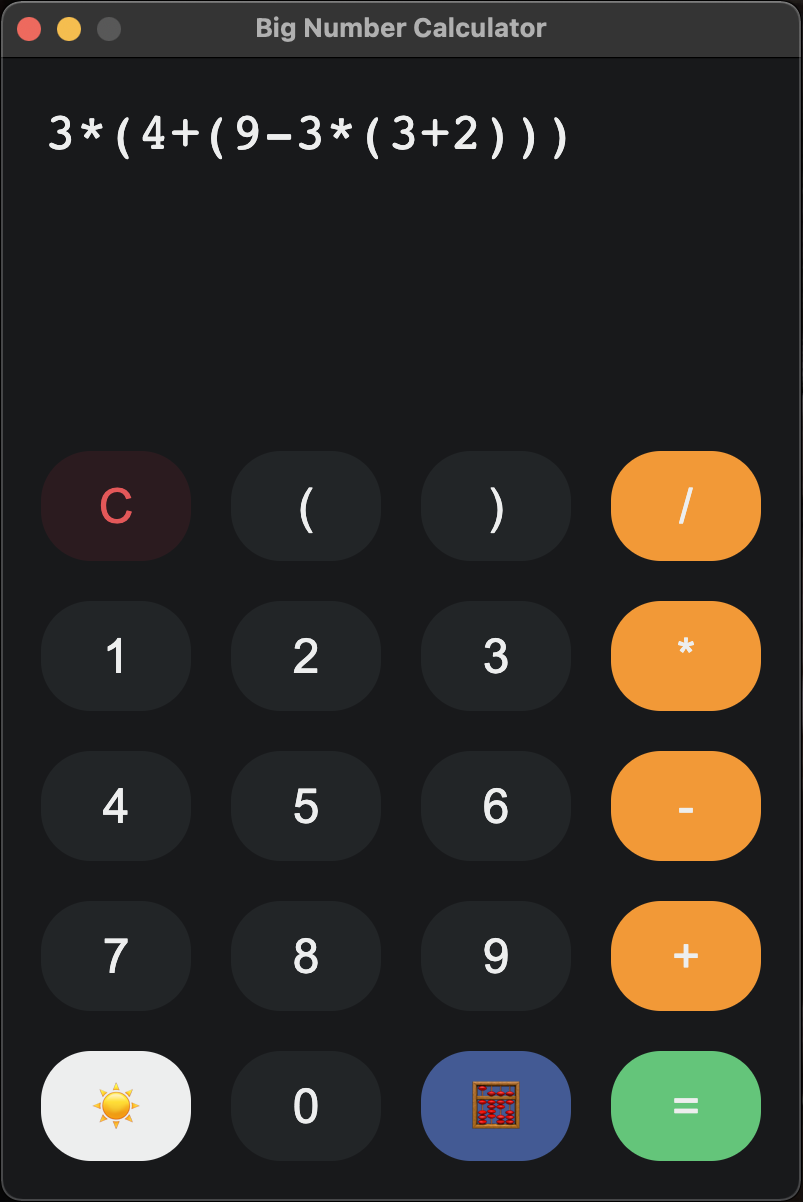
The Calculator support Big Number. It's only support parentheses. '(', ')' You can also calculate power of numbers but there is no button for that. you should type it '^'.
Note: to multiply use * between parentheses.
// examples
2(x + 3) ❌

2 * (x + 3) ✅
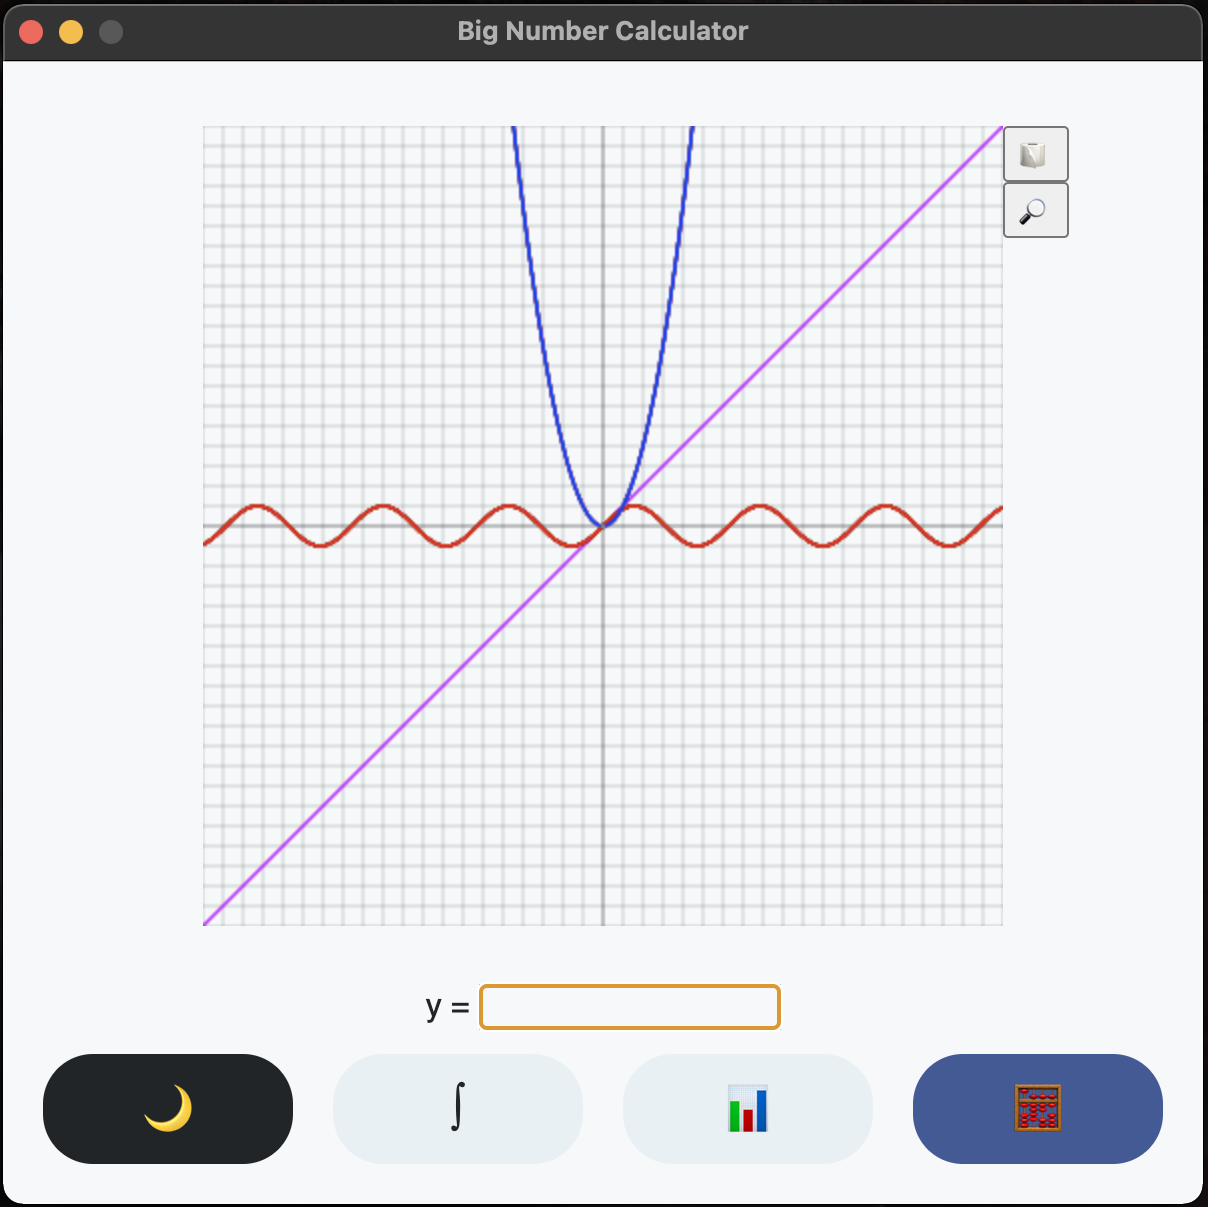
The idea behind Graph section is to calculate (x, y) and draw it on canvas, connecting these points should give us the graph. I tried to create grid by dividing the 400px canvas by 10px for each part. I have to admit, it didn't work that good with the decimal numbers.
Note: I evaluate the inputVal, because it was the easiest way to go. so to draw sin or pow, you should use Math.sin(x) and Math.pow(x, n).
// examples
y = x // ✅
y = 3 // ✅
y = -x + 3 // ✅
y = 2 * x + 4 // ✅
y = Math.pow(x, 2) // ✅
y = Math.sin(x, 2) // ✅
y = Math.log(x) // ✅
y = Math.abs(x) // ✅

y = 2x+1 // ❌
y = 3a // ❌
y = 2^3 // ❌
y = sin(x) // ❌
y = log(x) // ❌
The integral part use other methods to function. It basically replace x^a to x^a+1/a+1 and calculate x with boundaries then subtract them. it should gives us the approximately result.
Note: Right now, every 'x' should have power. even x --> x^1. hmmmmm
This project is part of Data-Structure exercise and written in short amount of time and not tested properly. It should be a bit buggy and featureless. Also not tested on other than MacOS Big Sur.