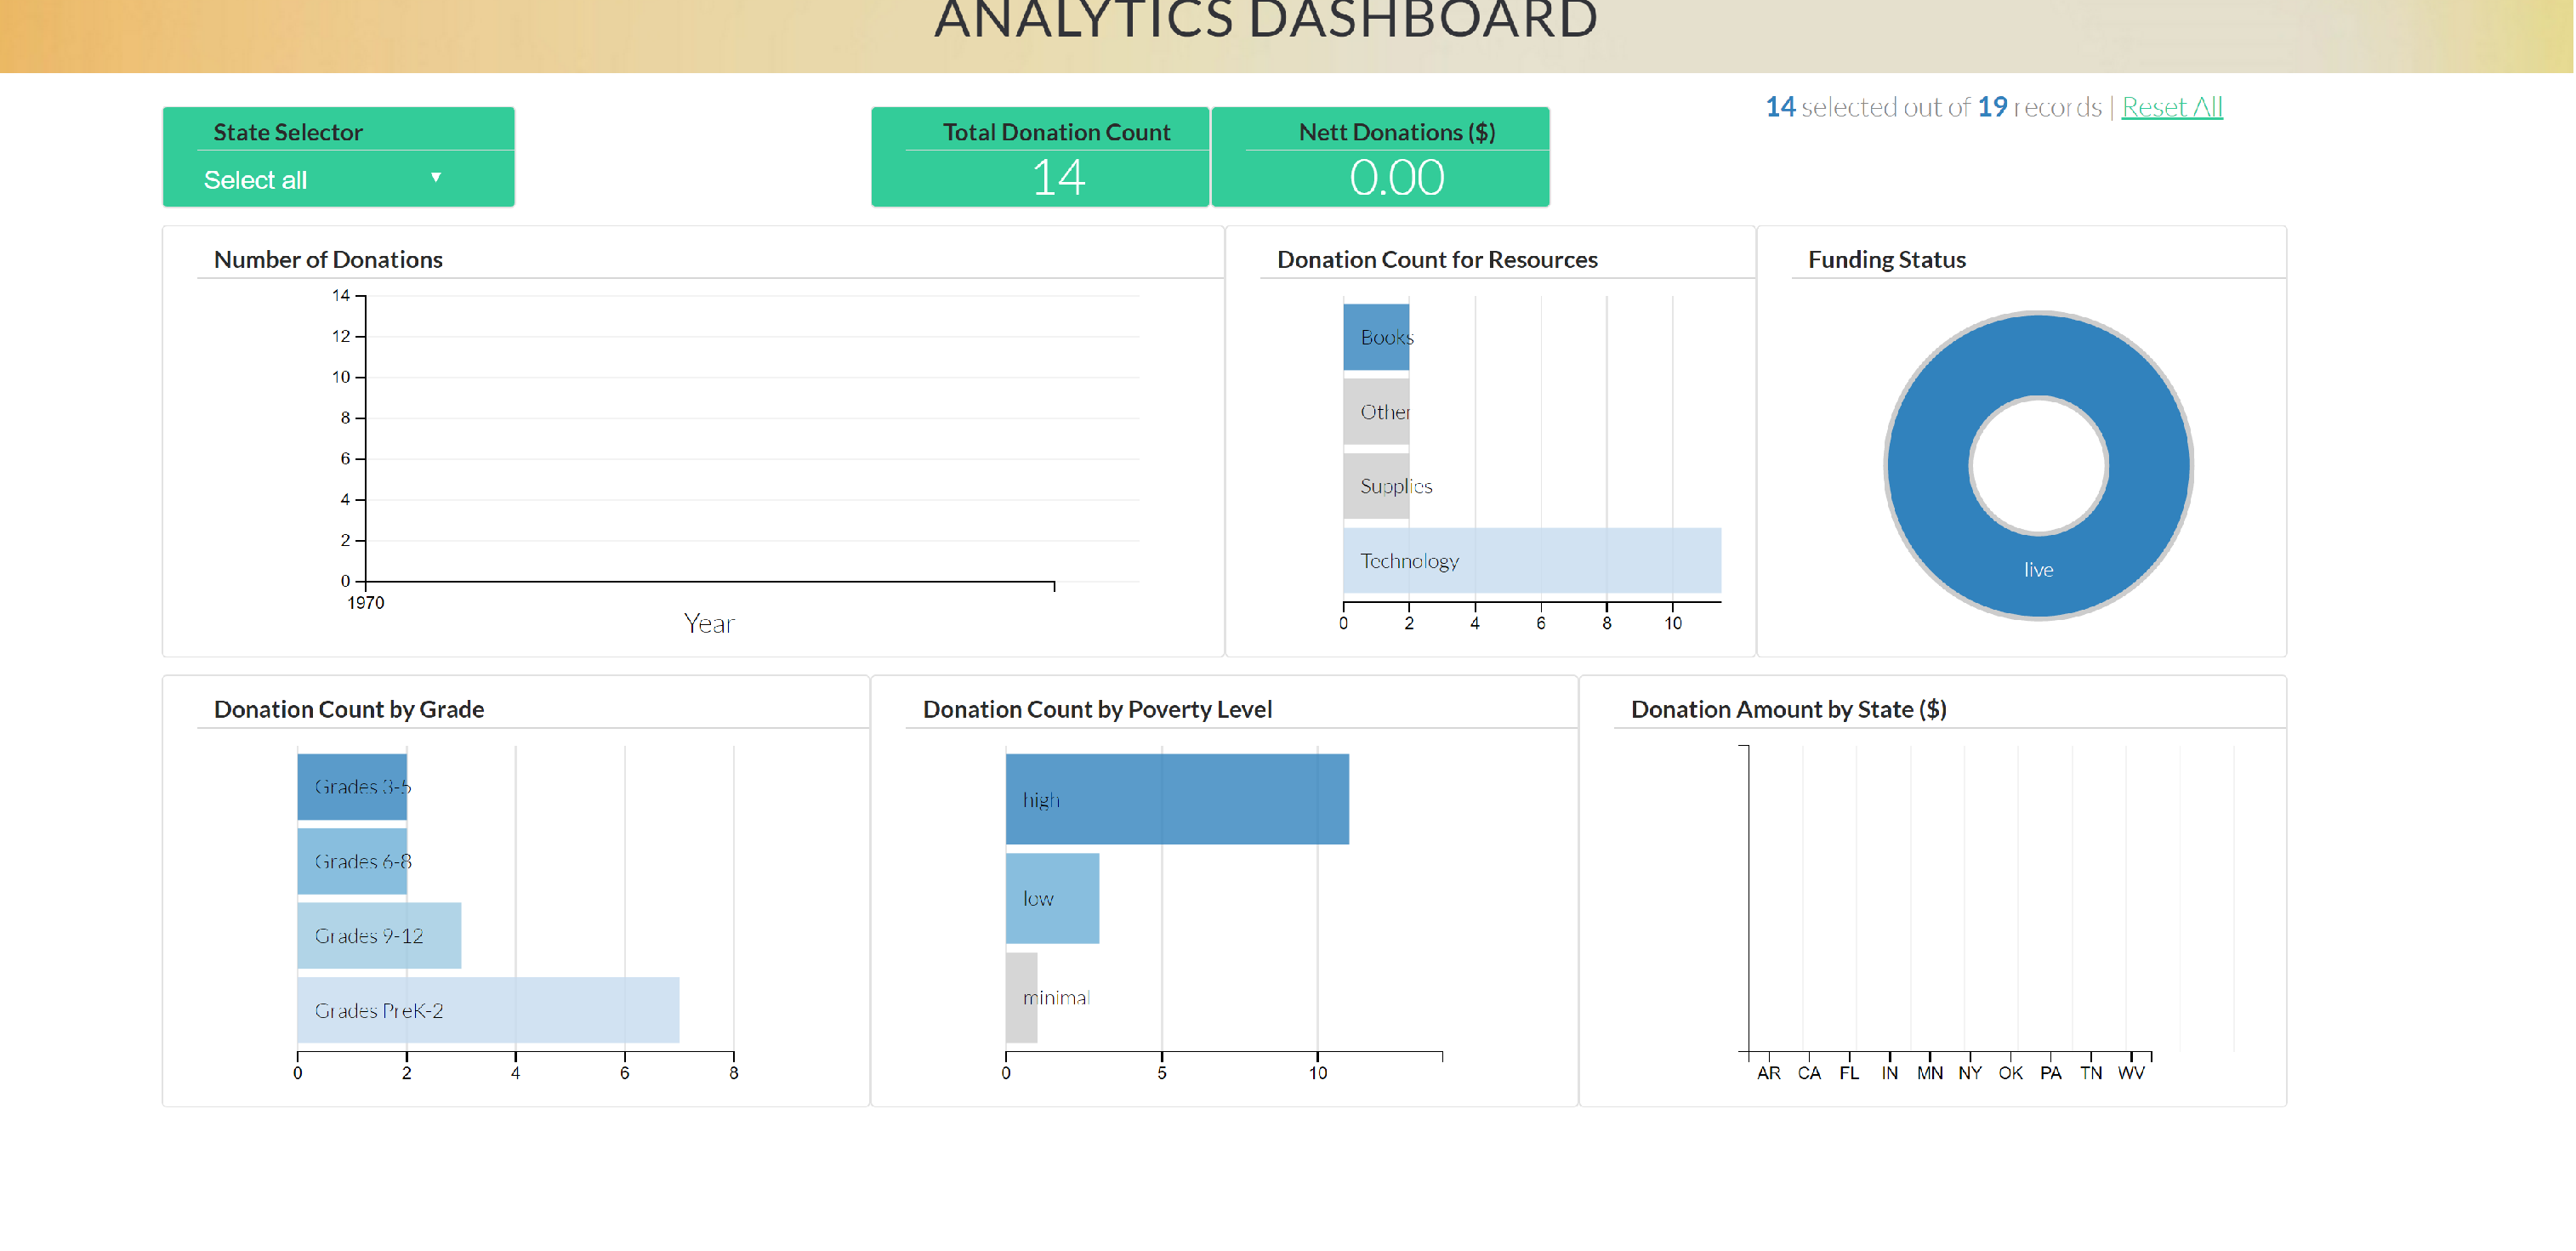
Create the visual charts with the data provide in Excel sheet. Import that CSV into mongoDB, then create the charts using D3.js
A javascript based visualization engine which will render interactive charts and graphs based on the data.
A javascript based wrapper library for D3.js which makes plotting the charts a lot easier.
A javascript based data manipulation library. Works splendid with dc.js. Enables two way data binding.
Our powerful server which serves data to the visualization engine and also hosts the webpages and javascript libraries.
The resident No-SQL database which will serve as a fantastic data repository for our project.
Open the command prompt, start mongo db by typing "mongod", it will start the mongodb.
Open another command prompt, start the mongo db by typing "mongo", then create new database "donorchoose".
Navigate to "data" folder and copy the file into "C drive"
type the following command
mongoimport -d donorchoose -c projects --type csv --file C:\projects-min.csv --headerline --upsert
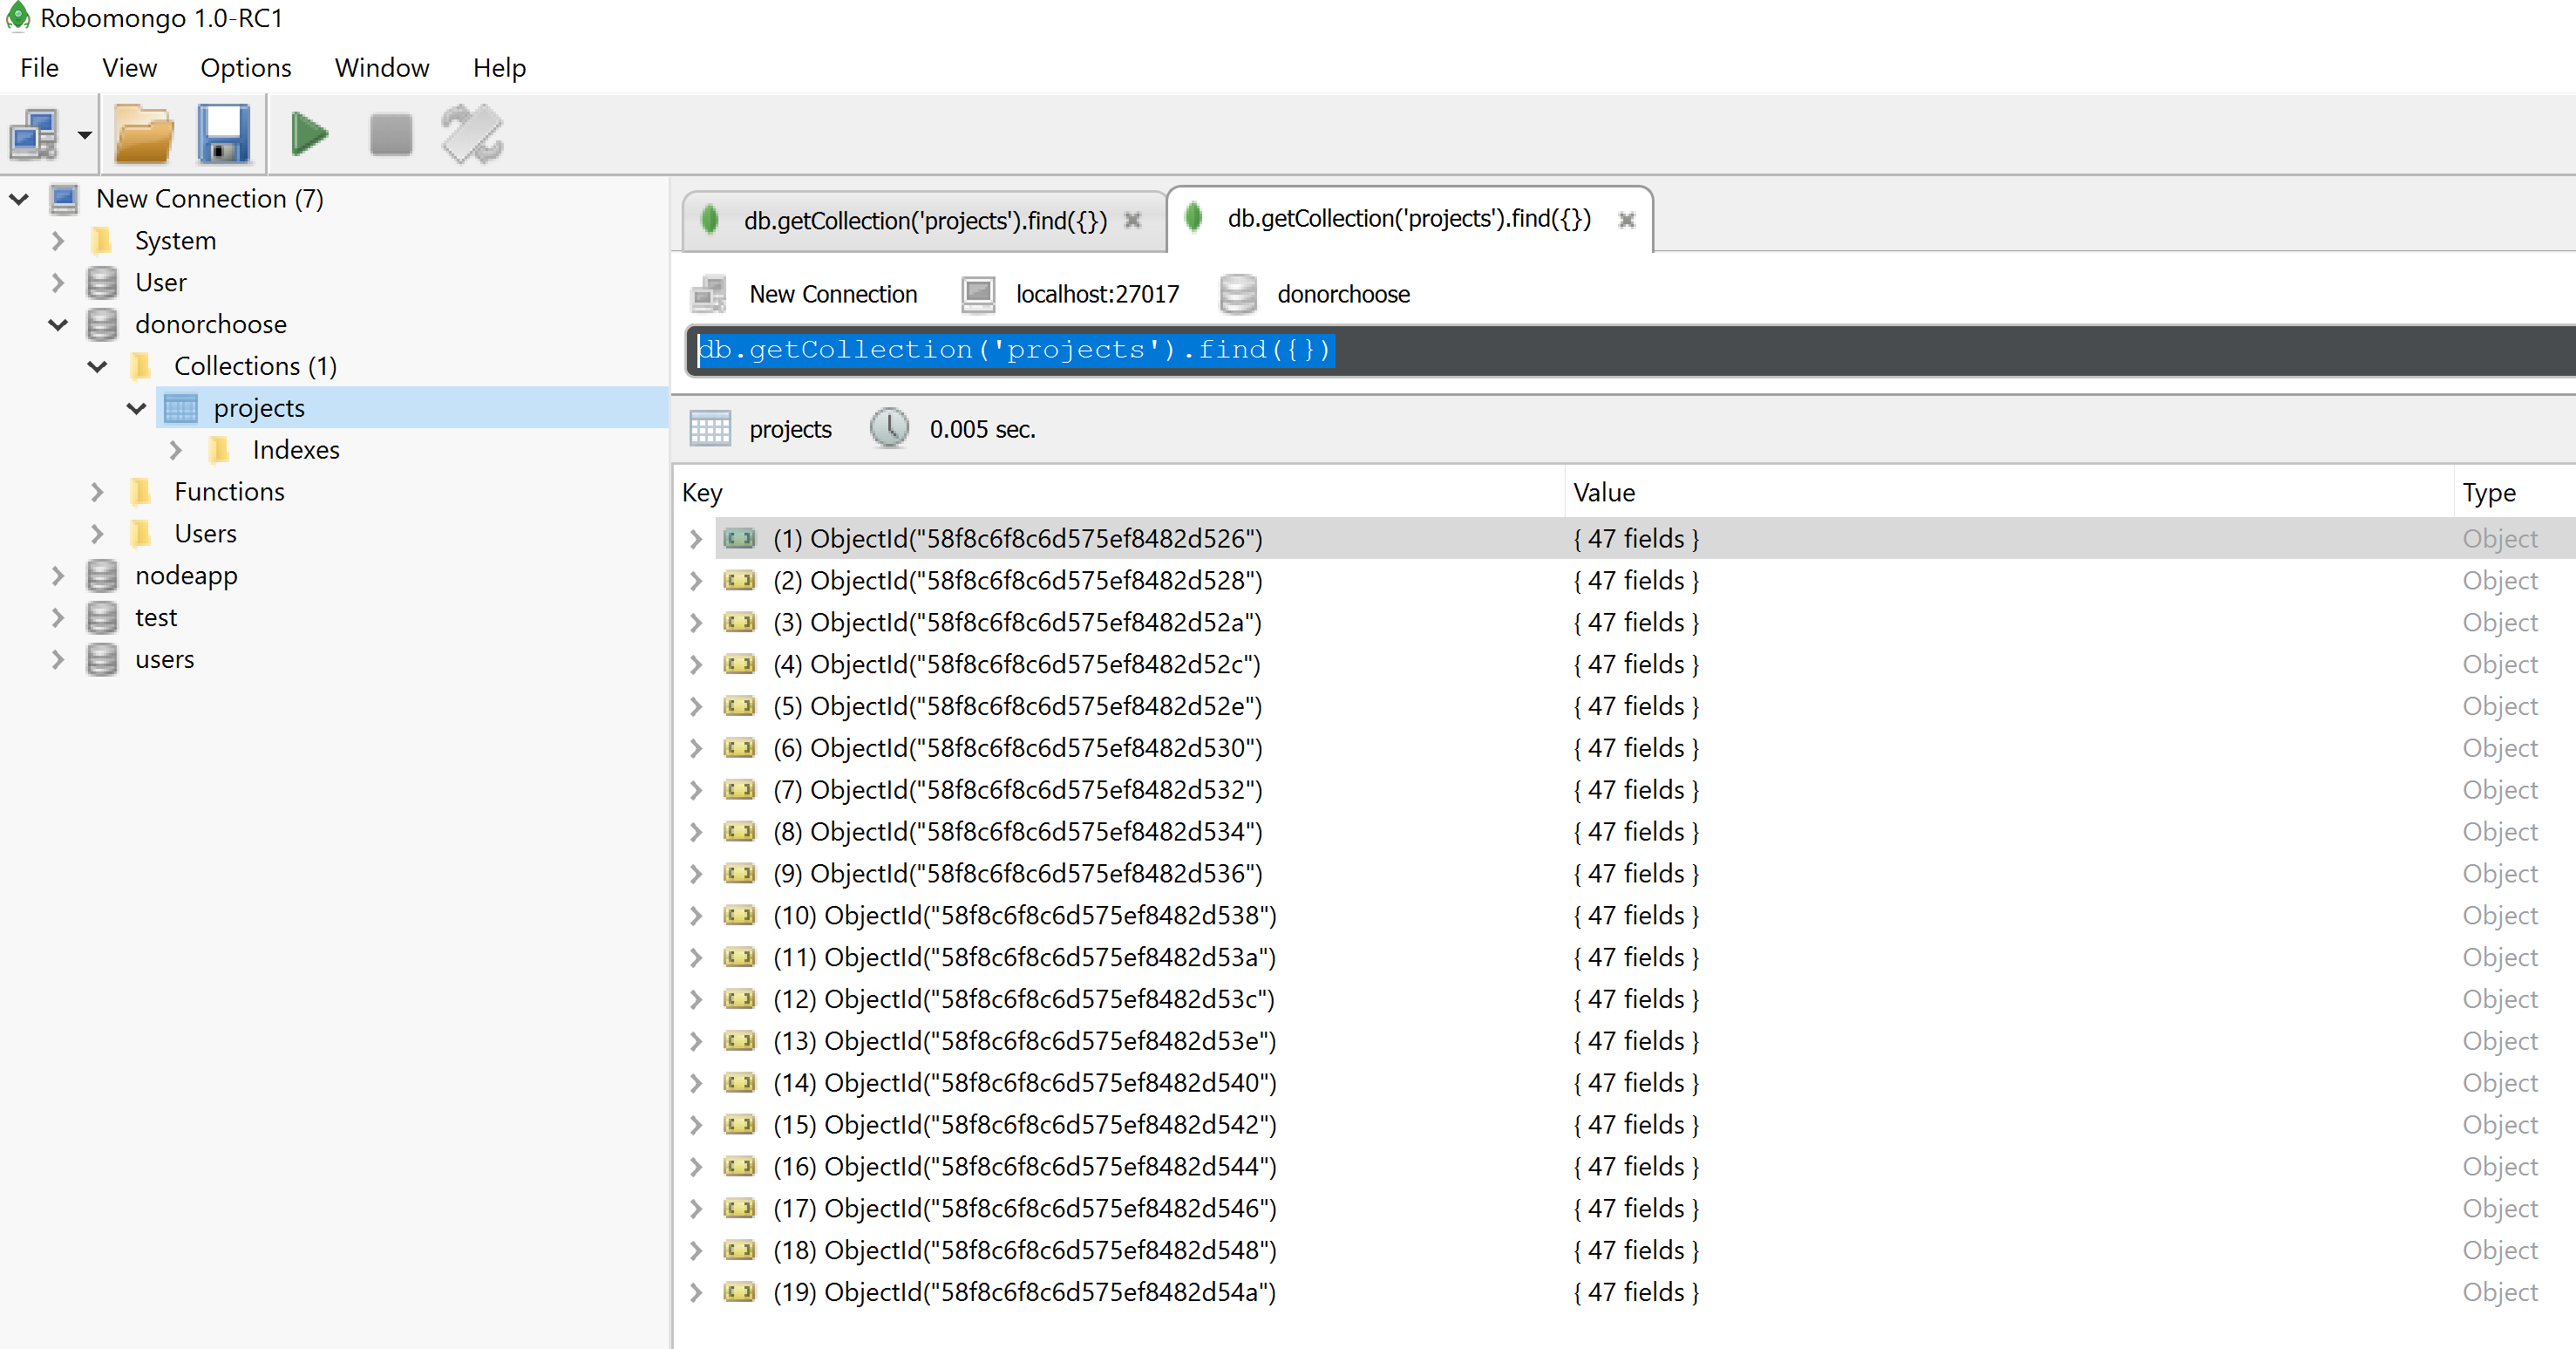
All imported records
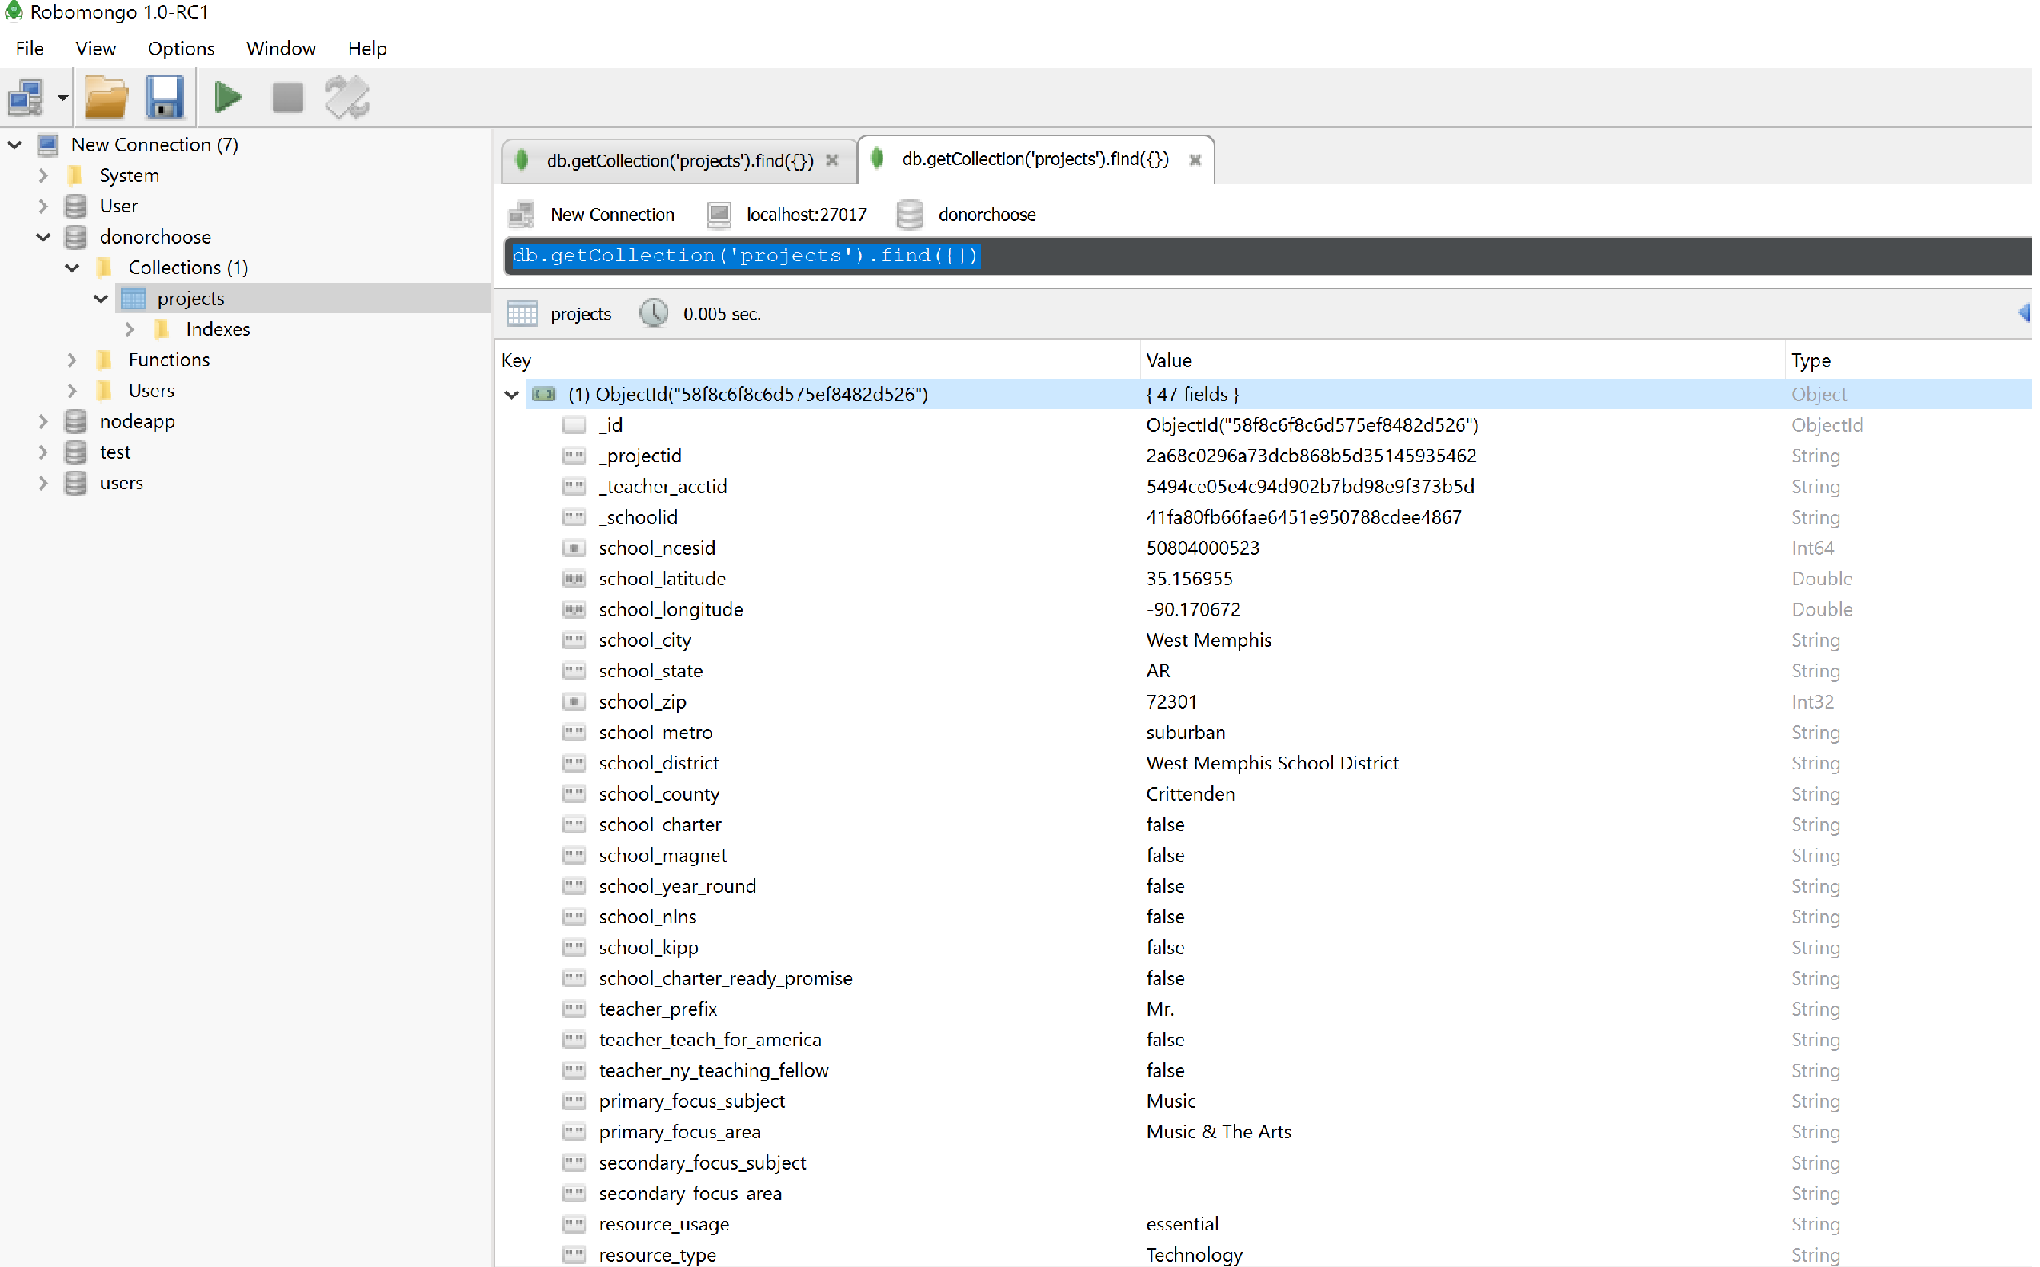
Single record
Navigate to main folder and
run npm install
it will install dependencies.
run *node server
and open http://localhost:8080


