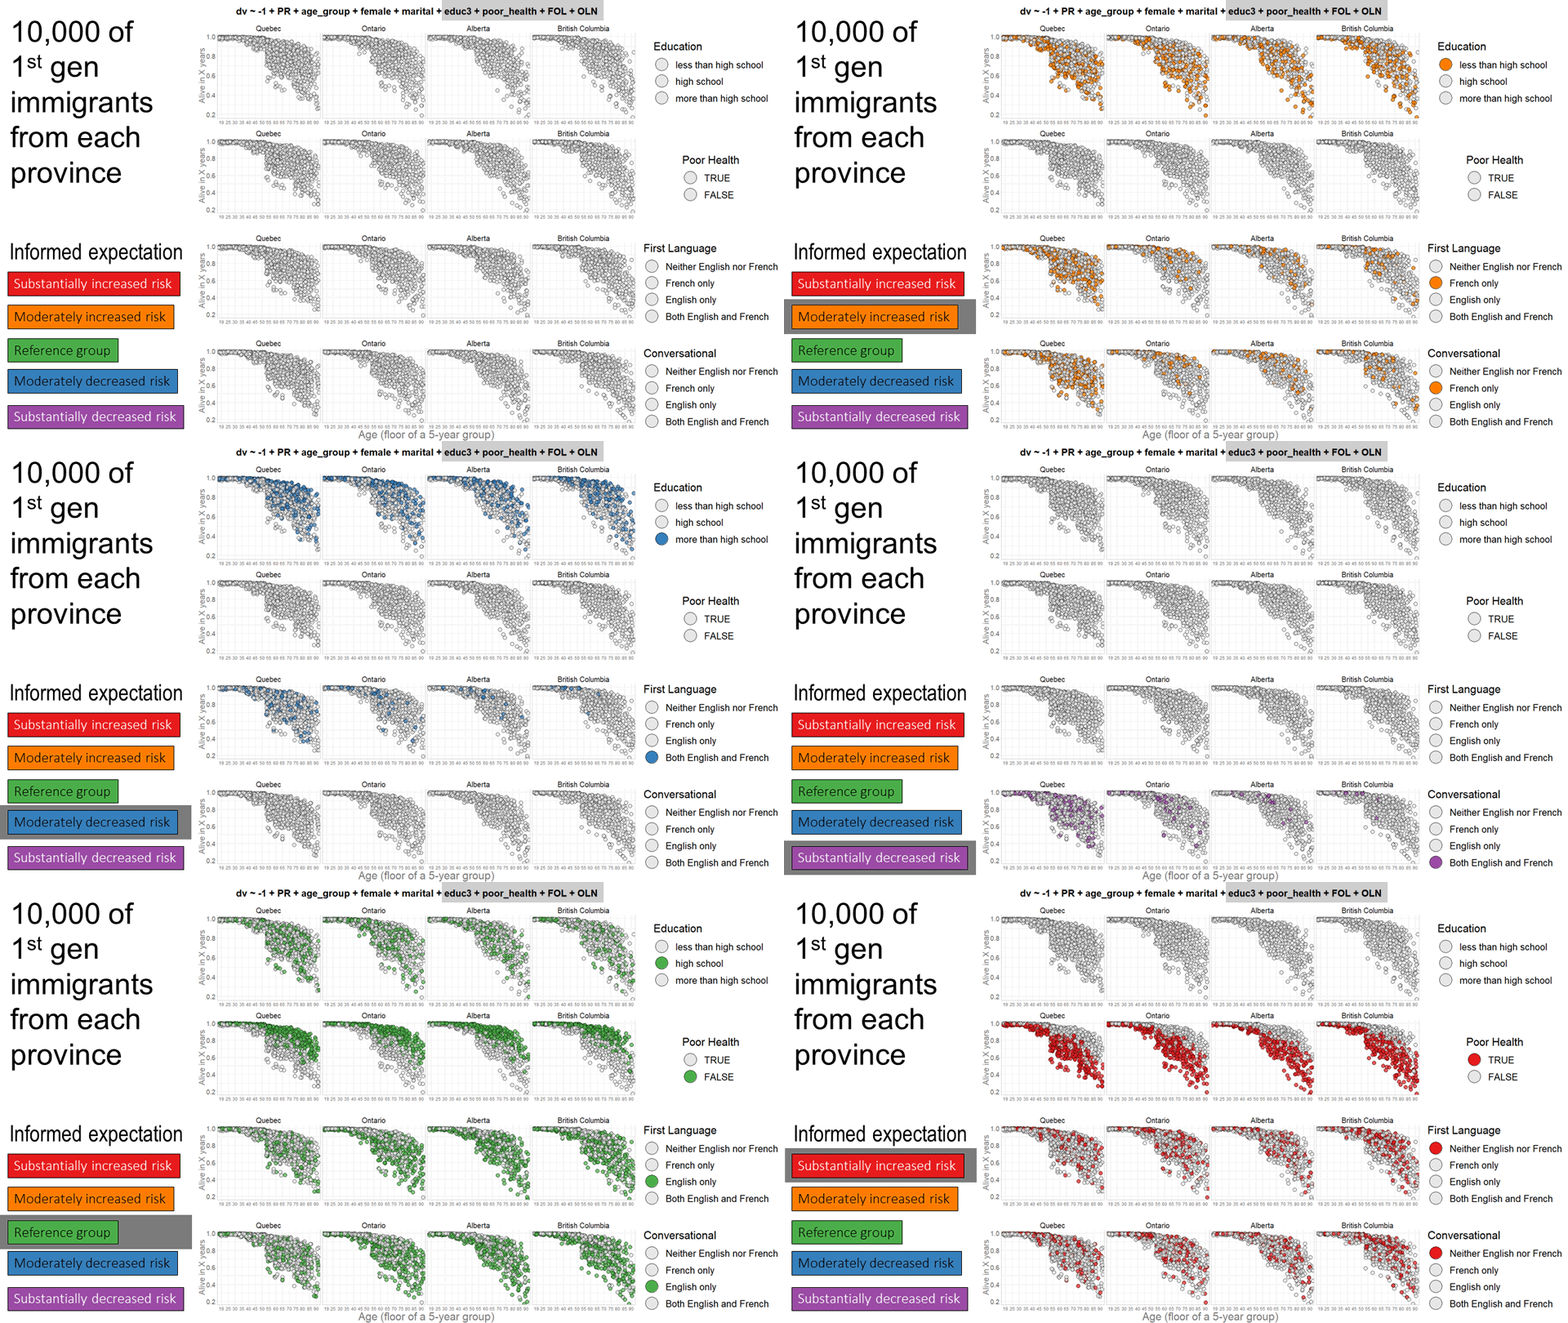
Demonstrating coloring-book techique of graph production in ggplot2 during data linkage hackathong at IPDLN-2018 conference at Banff, Sep 2018.
- April, 2016 - Groningen - Technique orignally developed for 2016 Maelstrom Harmonization Workshop ("Assessing the impact of different harmonization procedures on the analysis results from several real datasets"). View the slides
ialsa-2016-groningenpresenting the results of the exercise by Andriy Koval and Will Beasley. Groningen, Netherlands, April 22, 2016. - September, 2017 - Banff - Presentation of the slide deck of hackathon results to the closing plenary of IDPDL-2018 Conference in Banff, September 17 2018.
- October, 2017 - Victoria - Matrix Institue colloquium 2018-10-31 - slides for my talk When Notebooks are not Enough at the Matrix Institute colloquium at the University of Victoria on October 31, 2018
- November, 2017 Victoria - Popultaion Data BC Webinar 2018-11-01 -slides for my webinar Visulizing Logistic Regression at the Power of Population Data Science webinar series at PopDatBC on November 1, 2018.
- Clone this repository (either via git or from the browswer)
- Lauch RStudio project via .Rproj file
- Execute
./manipulation/0-metador.Rto generate an object that would store all the metadata - Examine
./manipulation/stitched_output/1-greeter.htmlto study the record of how we greeted the data provided to the hackathon participants. This data set is currently unavailable to the public, but please send a friendly tweet @StatCan_eng to let them know there is interest in this data set) - Examine
./reports/technique-demonstration/technique-demonstration-1.htmlto study the record of how models were estimated on the data provided to hackathon participants (really, please send a friendly tweet @StatCan_eng #letmydatago ) - Run
./reports/graphing-phase-only/graphing-phase-only.Rto load the model solution and start producing graphs
./manipulation/0-metador.Rrecords the definition of available variables, their factor levels, labels, description, as well as additional meta data (e.g. colors, fonts, themes)../manipulation/1-greeter.Rimports the raw data and perform general tweaks.
The product of these two scripts define the foundation of every subsequent analytic report.
ls_guide <- readRDS("./data-unshared/derived/0-metador.rds")
ds0 <- readRDS("./data-unshared/derived/1-greeted.rds")./reports/eda-1/eda-1- prints frequency distributions of all variables../reports/eda-1/eda-1a-first-gen-immigrant- repeats eda1 but for subsample of first-generation immigrants
Resulst of these two EDAs informed development of the script to estimate and to graph models of immigrant mortality:
./reports/coloring-book-mortality/coloring-book-mortality.R- implements analysis in the historic context of the IPDLN-2018-hackathon. Not a report, but a bare R script. Need to know the options before running. More for archeological purposes.
This script yeilded a collection of printed graphs stored in ./reports/coloring-book-mortality/prints/, visualizing three different collection of predictors from the same model. There were put together into this slide deck and presented during the closing plenary of IDPDL-2018 Conference in Banff.
./reports/technique-demonstration/- a cleaned, simplified and heavily annotated .R + .Rmd version of coloring-book-mortality.R script. Optimized for learning the workflow with the original data. For full details consult its stitched_output../reports/graphing-phase-only/- focuses on the graphing phase of production. Fully reproducible: works with the results of the models estimated during technical-demonstration, stored in./data-public/dereived/technique-demonstration/. For full details consult its stitched_output
- Stacey Fisher, Ph.D. Candidate, Ottawa Hospital Research Institute; ICES; University of Ottawa
- Gareth Davies, MSc, Research Data Analyst, SAIL Databank, Swansea University
- Andriy Koval, Health System Impact Fellow, BC Observatory for Population & Public Health
