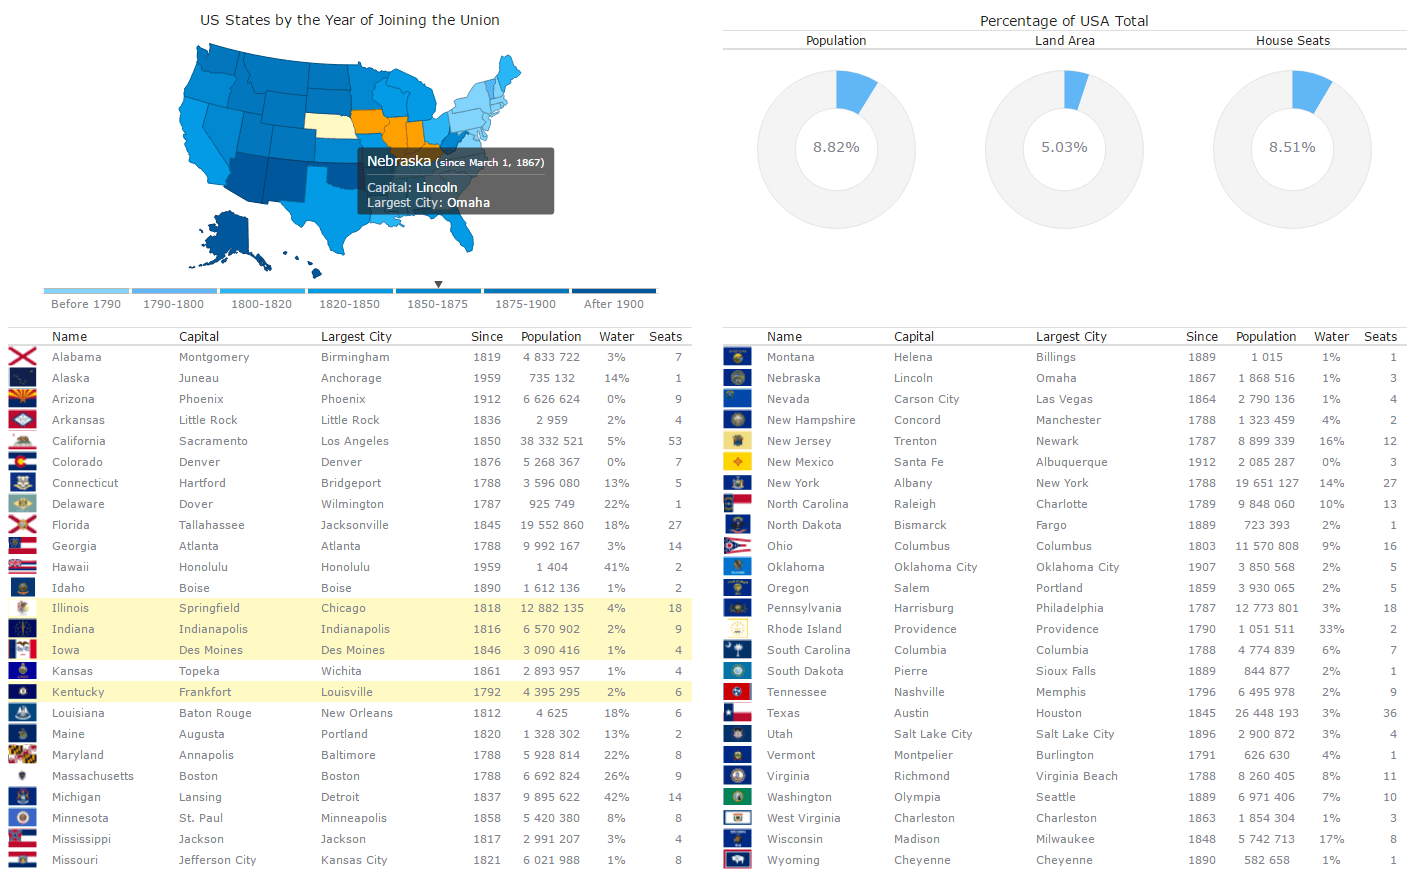
This HTML5 dashboard depicts data from the article "List of states and territories of the United States" on Wikipedia with the help of the JavaScript charting library of AnyChart. This is another eye-catching example of how JS charts and JS maps provided by AnyChart can be utilized for the statistical data visualization in addition to their perfect suitability for everyone who deals with the creation and use of dashboard, reporting, analytics, financial or any other data visualization solutions through HTML5.
- States of United States Dashboard at AnyChart.Com
- Documentation
- JavaScript API Reference
- Code Playground
- Technical Support
AnyChart States of United States Dashboard solution includes two parts:
- Code of the solution that allows to use Javascript library (in this case, AnyChart) to create a dashboard. You can use, edit, modify it, use it with other Javascript libraries without any restrictions. It is released under Apache 2.0 License.
- AnyChart JavaScript library. It is released under Commercial license. You can test this plugin with the trial version of AnyChart. Our trial version is not limited by time and doesn't contain any feature limitations. Check details here.
If you have any questions regarding licensing - please contact us. sales@anychart.com