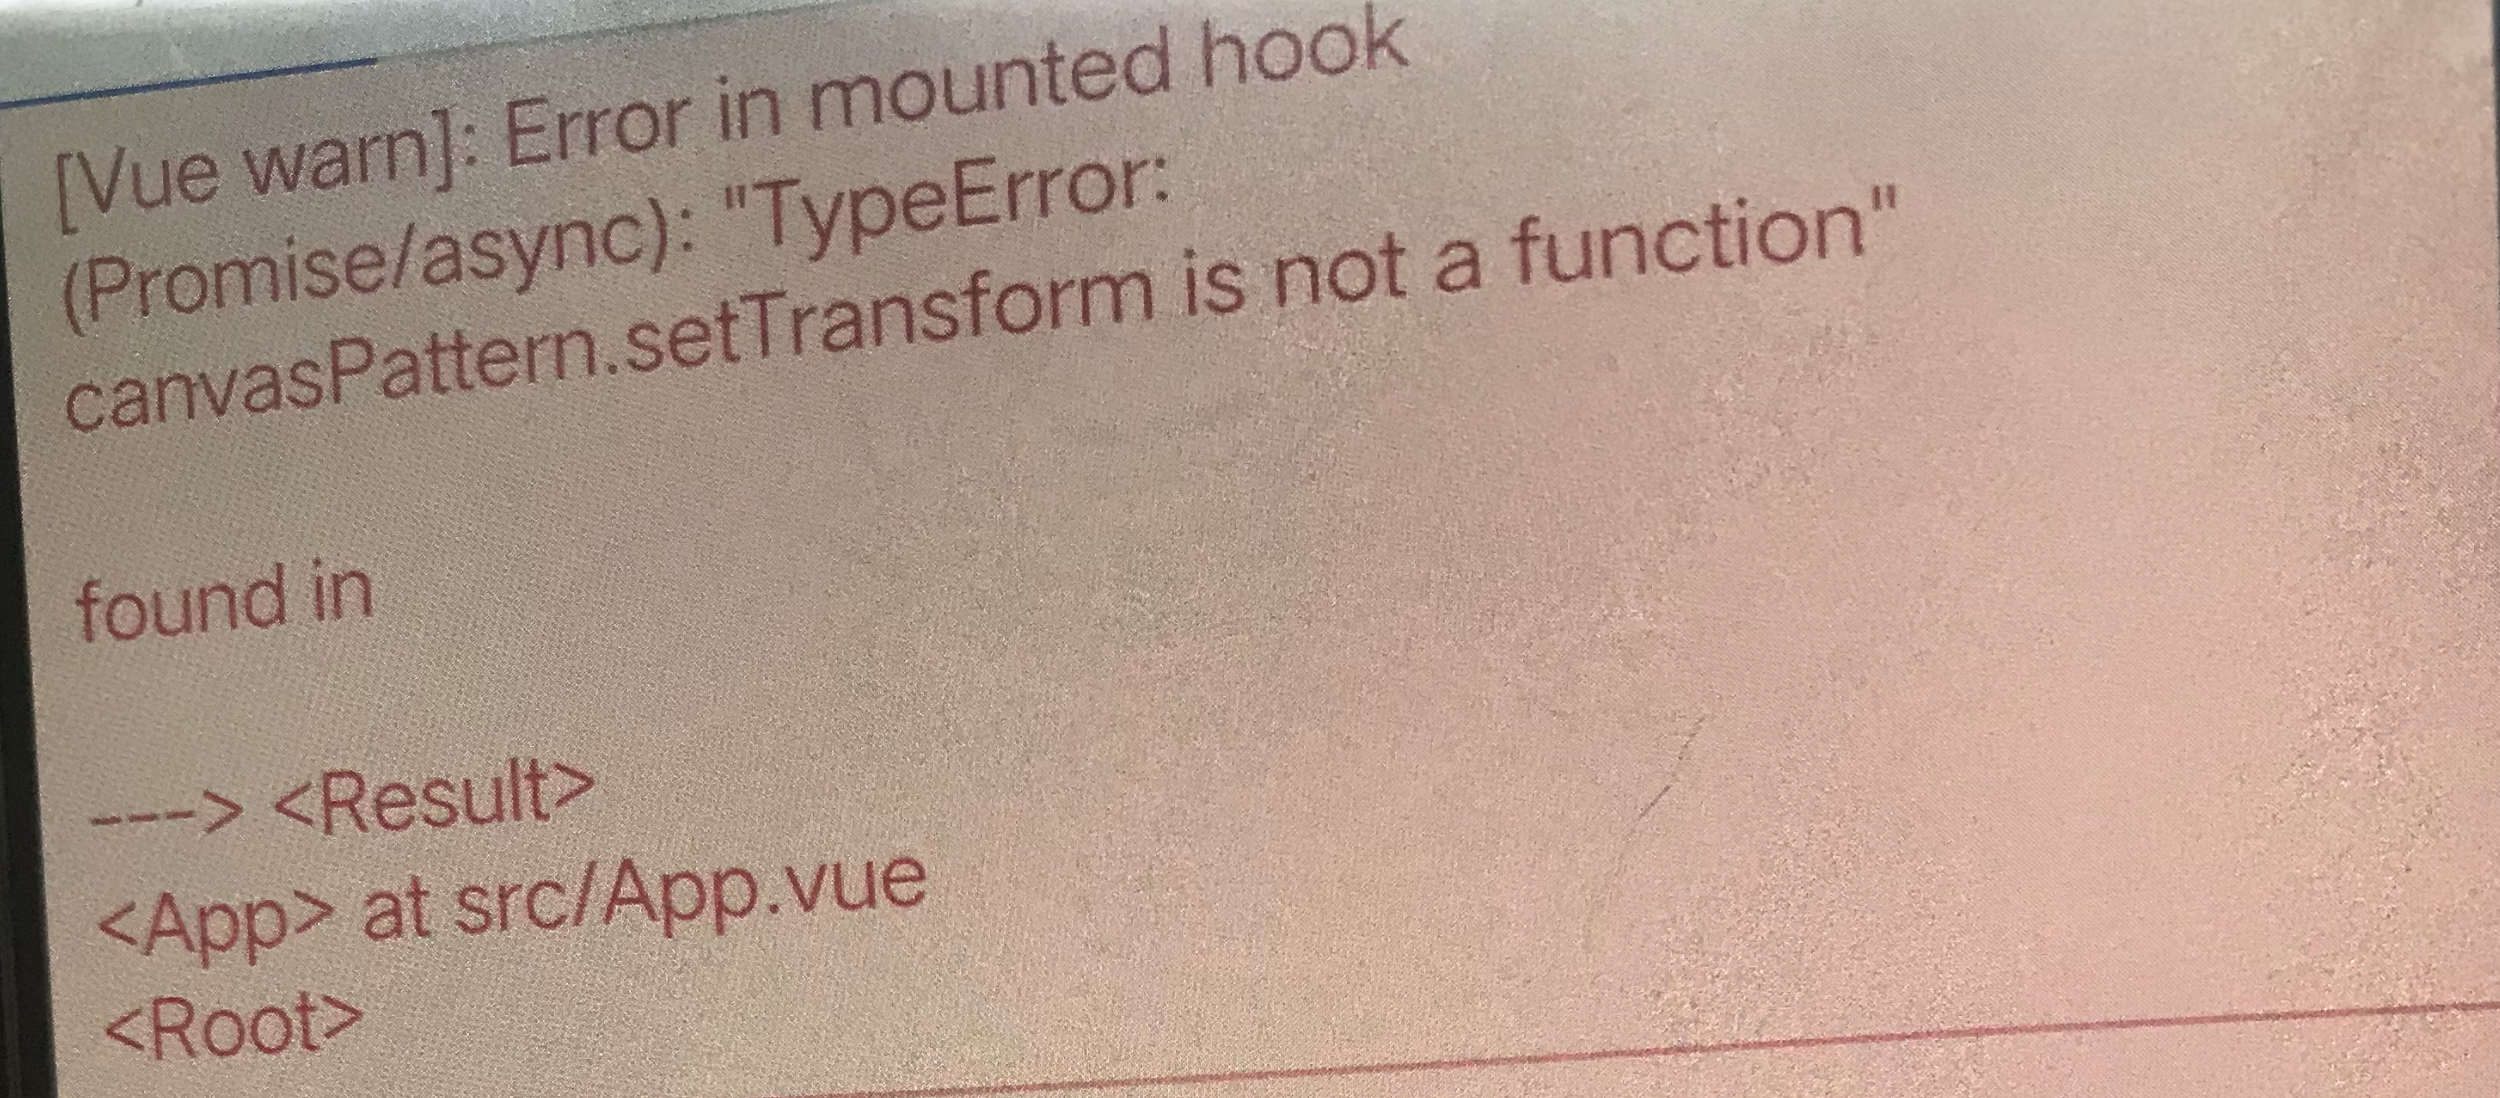
android8 【itemStyle-color-image】 is Script error #14536
Comments
|
Hi! We've received your issue and please be patient to get responded. 🎉 In the meanwhile, please make sure that you have posted enough image to demo your request. You may also check out the API and chart option to get the answer. If you don't get helped for a long time (over a week) or have an urgent question to ask, you may also send an email to dev@echarts.apache.org. Please attach the issue link if it's a technical question. If you are interested in the project, you may also subscribe our mailing list. Have a nice day! 🍵 |
|
@sandm1227 It seems you are not using English, I've helped translate the content automatically. To make your issue understood by more people, we'd like to suggest using English next time. 🤗 TRANSLATEDBODY Version5.0.2 Steps to reproduceimport * as echarts from 'echarts/core';
import {
GaugeChart
} from 'echarts/charts';
import {
CanvasRenderer
} from 'echarts/renderers';
echarts.use(
[GaugeChart, CanvasRenderer]
);
mounted() {
this._initEcharts();
},
method: {
_initEcharts() {
const chartDom = this.$refs.echartsDom;
const imagDom = this.$refs.processPic;
this.myChart = chartDom && echarts.init(chartDom);
this.chartOption = {
series: [{
z: 3,
type: 'gauge',
center: ["50%", "50%"],
radius: '98%',
min: 0,
max: 1000,
detail: {
valueAnimation: true,
formatter: '{value}%',
color: '#00BA38',
fontFamily: 'PingFangSC-Regular',
fontSize: '30',
offsetCenter: [0, 0]
},
title: {
color: '#00BA38',
fontFamily: 'PingFangSC-Regular',
fontSize: '12',
offsetCenter: [0, '-30%']
},
startAngle: 212,
endAngle: -32,
data: [{
value: 1000,
name: '我的薪资'
}],
axisLine: { // 仪表盘轴线(轮廓线)相关配置。
show: false, // 是否显示仪表盘轴线(轮廓线),默认 true。
},
axisTick: {
show: false
},
axisLabel: {
show: false
},
pointer: {
show: false
},
splitLine: {
show: false,
},
progress: {
show: true,
width: 24
},
itemStyle: {
color: {
image: imagDom,
repeat: 'no-repeat'
},
}
},
{
name: '业务指标2',
type: 'gauge',
center: ['50%', '50%'],
radius: '98%',
detail: {
show: false
}, // {formatter: '{value}'},
startAngle: 212,
endAngle: -32,
axisLine: { // 仪表盘轴线(轮廓线)相关配置。
show: true, // 是否显示仪表盘轴线(轮廓线),默认 true。
lineStyle: { // 仪表盘轴线样式。
color: [
[0, 'pink'],
[1, '#DEDBD7']
],
width: 24, //轴线宽度,默认 30。
shadowColor: "#fff", //阴影颜色。支持的格式同color。
}
},
splitLine: {
show: false,
},
axisTick: {
show: false
},
axisLabel: {
show: false
},
pointer: {
show: false
},
}
]
}
// 绘制图表
this.myChart.setOption(this.chartOption);
}
}<div class="respage-infoBox-topRight-echarts" id="echartsDom" ref="echartsDom"></div>
<img src="@/assets/表盘-背景色-t.png" ref="processPic" v-show="false" />What is expected?Android phone can be filled with image What is actually happening?The image on the android phone can't be filled in, reporting the wrong Script error |
|
请提供更多信息帮助我们排查问题 |
|
|
改成svg渲染模式,可以解决上述问题了。 |

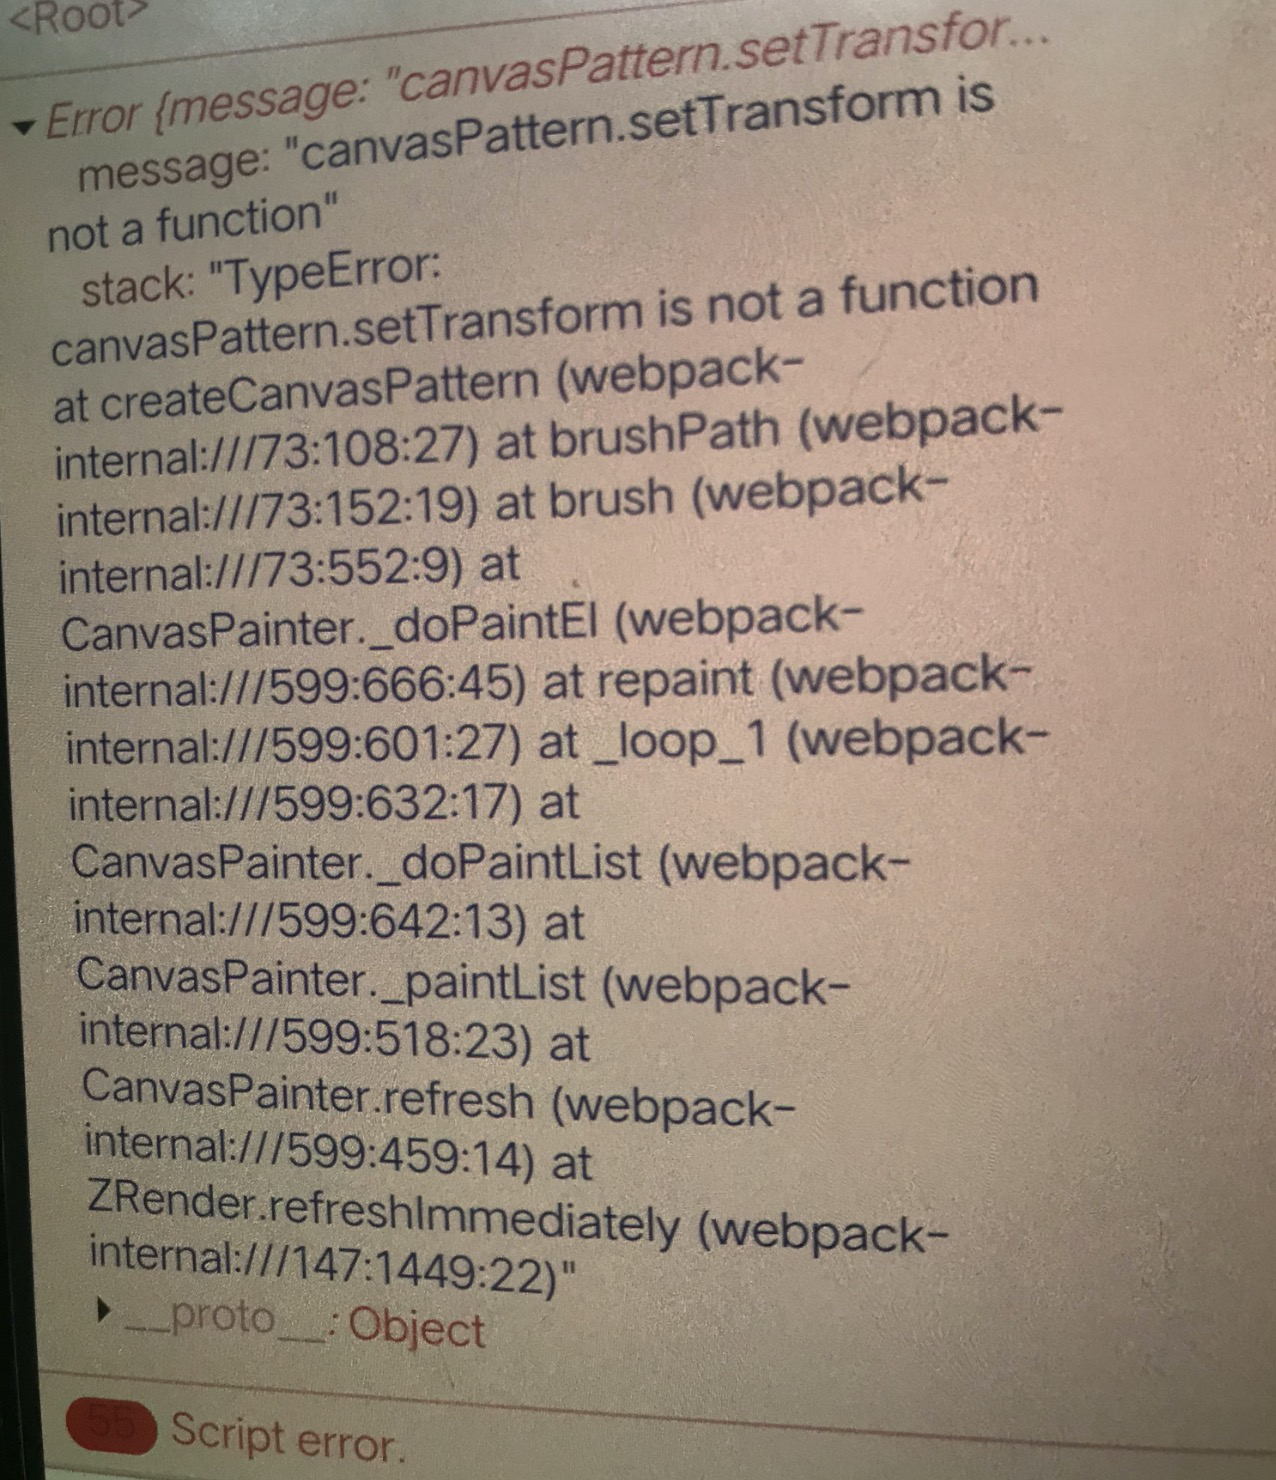
fix: CanvasPatttern#setTransform may not exists apache/echarts#14536
|
ios12.4 也无法使用image填充,console无报错显示 |
Version
5.0.2
Steps to reproduce
What is expected?
android手机上可以image填充
What is actually happening?
android手机上image无法填充,报错Script error
The text was updated successfully, but these errors were encountered: