[FLINK-15171] [serialization] fix performance regression caused by too many buffer allocations on string serialization #10529
Conversation
|
Thanks a lot for your contribution to the Apache Flink project. I'm the @flinkbot. I help the community Automated ChecksLast check on commit 234e7ef (Wed Dec 11 11:10:25 UTC 2019) Warnings:
Mention the bot in a comment to re-run the automated checks. Review Progress
Please see the Pull Request Review Guide for a full explanation of the review process. The Bot is tracking the review progress through labels. Labels are applied according to the order of the review items. For consensus, approval by a Flink committer of PMC member is required Bot commandsThe @flinkbot bot supports the following commands:
|
|
Raw serialization microbenchmarks: before this PR: After this PR: |
CI report:
Bot commandsThe @flinkbot bot supports the following commands:
|
|
And the problematic flink-benchmarks: so if you stress the GC hard enough, it will start interfering with the benchmark code. |
234e7ef
to
ec40a21
Compare
|
A good follow-up question is "how large should be the It can be trivially bumped to something like 64kb without any drawbacks, but from my personal experience with Apache Flink, giant strings are quite a rare case in real world projects. And for 1kb+ strings, the original PR already improves the situation. |
There was a problem hiding this comment.
Thanks for the update, but I have some doubts/questions.
I see from where the extra byte[] allocations were coming from, but I do not understand where did the char[] come?
      bytes  percent  samples  top
  ----------  -------  -------  ---
  8222540128   32.45%    40779  byte[]
  7509810768   29.64%    37258  char[]
Secondly, we have executed this fix on the benchmarking machine, but it doesn't seem like fixed the issue:
https://imgur.com/oeInxQm
For example serializerTuple before the regression had ~680, while after the regression 590-618. This PR's result is ~605 which is in the range “after the regression” 😕
http://codespeed.dak8s.net:8000/timeline/?ben=serializerTuple&env=2
The same could be said about serializerRow which is also below the pre-regression levels (630-640)
| if (len < SHORT_STRING_MAX_LENGTH) { | ||
| // skip allocating a separate buffer and reuse the thread-local one. | ||
| // as allocating the buffer for small strings can produce too much GC pressure. | ||
| buf = shortStringBuffer.get(); | ||
| in.readFully(buf, 0, len); | ||
| } else { | ||
| buf = new byte[len]; | ||
| in.readFully(buf); | ||
| } |
There was a problem hiding this comment.
Definitely one issue with this approach is that we do not have benchmark coverage for strings > 1KB. SerializationFrameworkMiniBenchmarks#serializerHeavyString as I can see is using just 1KB strings? Maybe it just barely qualifies for the non ThreadLocal branch, but if we wanted to go such direction, we would need to either decrease the size of the buffer (100?) or incease strings in serializerHeavyString (SHORT_STRING_MAX_LENGTH * 1.5 ?).
However do we even need such if (len < SHORT_STRING_MAX_LENGTH) branch (both here and below)? Couldn't this have a single per thread fixed size buffer, but if the string is larger then the buffer's max size, read/write string from/to the fixed size buffer size in steps? like:
for step in 0..string.size()/buf.length:
  for i in 0..buf.length:
     buf[i] = string[step * buf.length + i]
  // process buffer
or probably more precisely:
for step in 0..string.size()/buf.length:
    in.readFully(buf, 0, buf.length)
    // process buffer
|
@pnowojski thanks for the feedback. Current status:
The most concerning thing for me is being unable to reproduce the performance regressions on flink-benchmarks. I will try to run them on similar 4-core EC2 instances like c4, hopefully it will help me to understand what's going on. But my main suspect is GC pressure, and both of the planned changes should reduce it quite significantly. |
ec40a21
to
c1b7024
Compare
|
@shuttie , yes, I think the GC pressure is the prime suspect here. For example the brief blimp in the performance on the timeline around http://codespeed.dak8s.net:8000/timeline/?ben=serializerTuple&env=2 was caused by some memory related configuration changes (part of another investigation). I've revert those changes after a couple of runs, to not skew benchmark results for this regression. Once you have provided an update, please ping me or @rkhachatryan so we can re-trigger the benchmark request run :) |
|
One more thing
Yes, I've seen it, as far as I can tell, you haven't increased the amount of |
a80a9ad
to
754decc
Compare
|
@pnowojski @rkhachatryan So looks like that I was able to understand what's going on with this performance regression. To reproduce the issue I had to write yet another benchmark mimicking the one in Compared to the original pre-1.10 implementation, we do much more things in the new version:
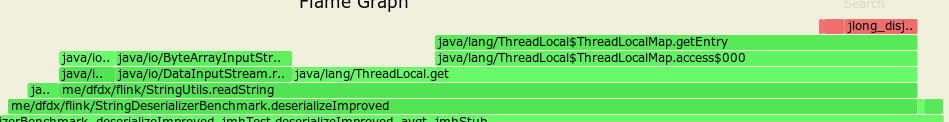
As @pnowojski suggested, there is no need to compute exact buffer size while doing serialization on step 1, we can allocate a small buffer and flush it when it's exhausted. Also, as this small buffer has fixed size, a simple idea was to allocate it once in ThreadLocal and reuse it later: The results were a bit better, as we never scanned the string twice and significantly reduced the number of allocations. But the results were still not that good as before. Surprisingly, ThreadLocal manipulations took most of the time:
Then we made a test without ThreadLocal, but with fixed-size allocated buffer of size 8 and 16: It improved the situation quite dramatically. We also did a set of benchmarks to observe the impact of buffer size on read/write performance for strings of different length: usually the larger the buffer, the better the performance. But allocating a large buffer for a short string seems to be a bit wasteful, so we tried to make a flexible implementation of buffer sizing (like If you check the output of perfasm profiler comparing buffer[16] and buffer[dynamic] variants, you will notice that when you allocate a small byte array with known size at the moment of compilation, then JVM can do scalarisation: skip heap allocation, and allocate only 16 bytes right on the stack. When the buffer is dynamic, then it's always going to heap with significant performance penalty. As for the increased number of char[] allocations - it looks like to be related to the benchmarking process. As if you increase throughput, then you increase the number of Strings produced by serializer, then increasing the number of chars[] allocated. So, to sum up the current status of this PR:
|
|
Looks like I was over-optimistic: while running
I will try to reproduce the issue yet another time, but with different underlying buffer implementations. |
|
Thanks for the update @shuttie I will be waiting for your next update.
Indeed that could be causing some differences. Regarding the As I wrote in the previous message, if you compare relative Re the |
754decc
to
c0e1c8f
Compare
|
@pnowojski @rkhachatryan Indeed after creating a more proper microbenchmark using exactly the same input/output buffer implementations as in Surprizingly, running serialization code over Buffering helped to avoid these heavy per-byte read/write calls, but running the same code, but over After staring for a long time to the perfasm listings of the code in FLINK-14346, we found that:
So seems that idea to add buffering was not that good initially. But still some of the ideas in original FLINK-14346 implementations were still worth checking, so we did:
At the end, the final results seem to show a nice +30% improvement for both write and read throughput on microbenchmark (but not as nice as originally claimed, unfortunately): On before FLINK-14346: with FLINK-15171: I'm currently preparing a PR to |
…o many buffer allocations on string serialization
c0e1c8f
to
4408ae8
Compare
There was a problem hiding this comment.
Thanks for the fix. I've executed a benchmark-request on it, and indeed it looks like a performance regression is gone. With a single run it's hard to say if there is some couple of % change either direction (improvement or regression), it would have to be checked via longer trend.
LGTM, merging.
What is the purpose of the change
FLINK-14346 Introduced a faster implementation for string [de]serialization. But while running the flink-benchmarks suite, there was a performance regression found for almost all serialization tests: a significant 10% drop-down for the total job throughput.
Flame graph before the FLINK-14346 was applied:
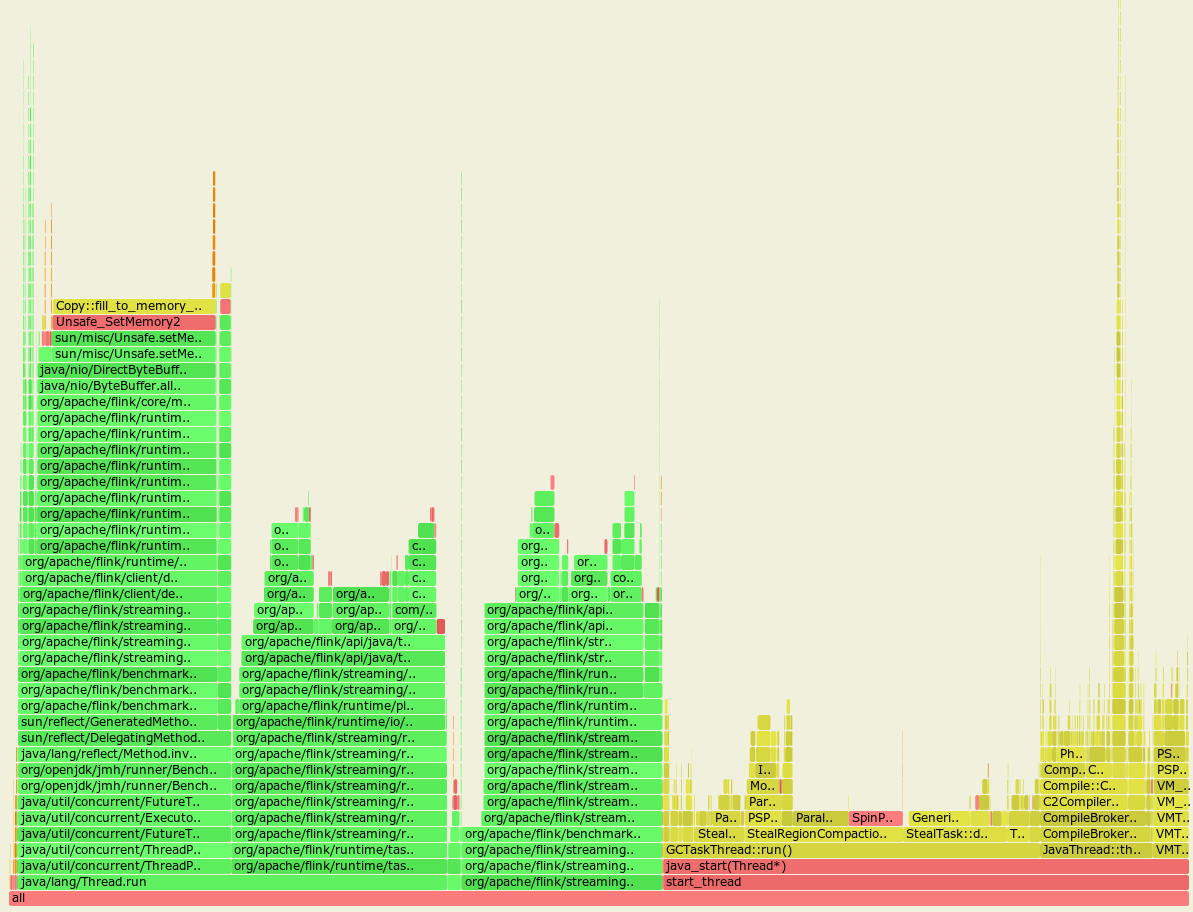
Flame graph after the FLINK-14346 was applied:
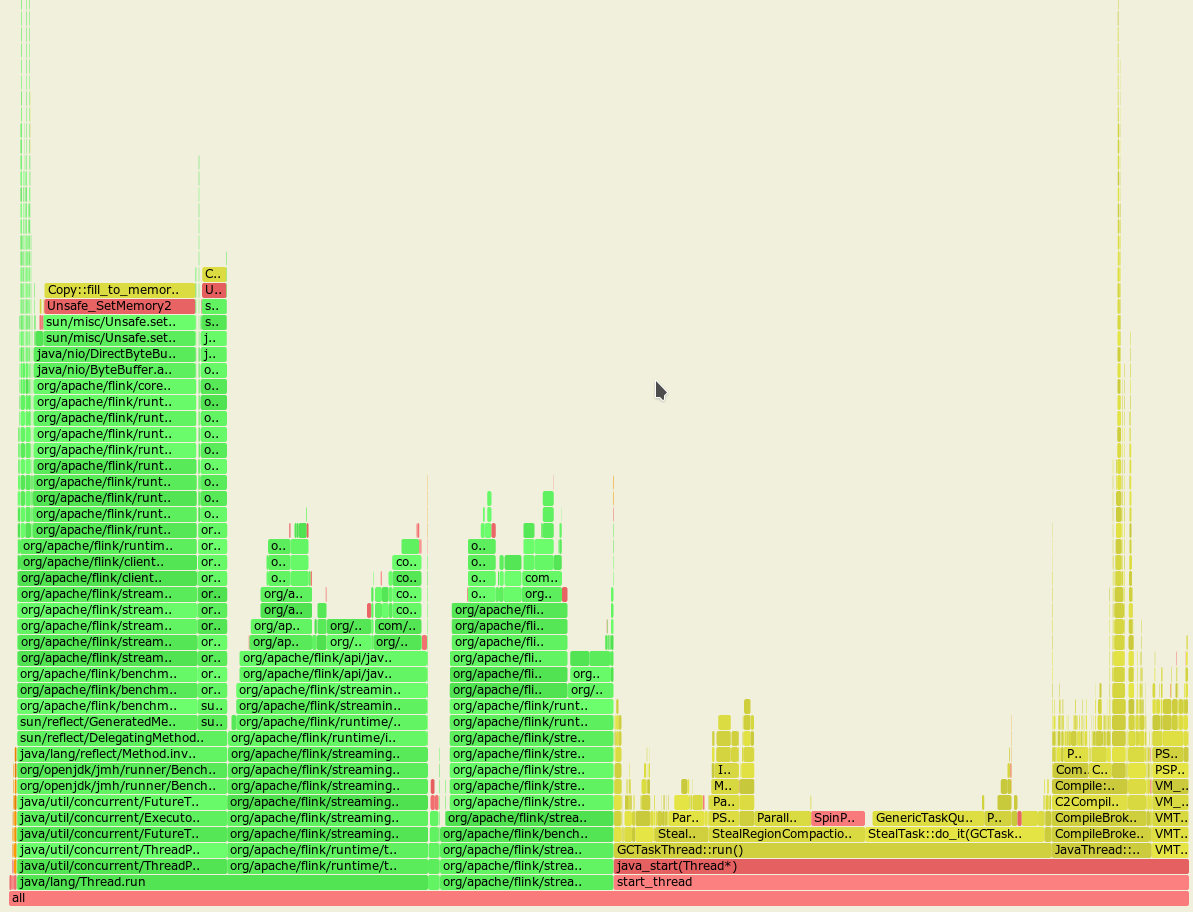
From these almost identical graphs we may notice that the GC spends much more time cleaning up the heap with the FLINK-14346 applied.
Running the new and old code with the allocation profiling proved the theory with higher allocation rate:
Top allocations, with FLINK-14346:
Top allocations, no FLINK-14346:
So almost third of all the allocations made were done for these intermediate array buffers.
All the benchmarks posted in the original PR were done on Ryzen 7 2700 (8 physical cores), and the CPU used for the
flink-benchmarksis i7 7700 (4 physical cores). Also note that almost all the flink-benchmarks use parallelism=4, so:With this PR we did the following:
ThreadLocal<byte[]>buffer for short strings smaller than 1024 charactersBrief change log
Verifying this change
This change is already covered by existing tests, such as StringSerializationTest.
Does this pull request potentially affect one of the following parts:
@Public(Evolving): (yes / no)Documentation