Add a new visualizer 'Response Time Graph' to draw a line graph showing the evolution of response time for a test #2884
Comments
|
@milamberspace (migrated from Bugzilla): |
|
@milamberspace (migrated from Bugzilla): |

|
@milamberspace (migrated from Bugzilla): |

|
@milamberspace (migrated from Bugzilla): |

|
@milamberspace (migrated from Bugzilla): |

|
@milamberspace (migrated from Bugzilla): Added: |
|
@milamberspace (migrated from Bugzilla): Modified: |
|
@milamberspace (migrated from Bugzilla): Modified: |
|
@pmouawad (migrated from Bugzilla): |
|
@milamberspace (migrated from Bugzilla): Added: |
|
@milamberspace (migrated from Bugzilla): Added: |
|
@milamberspace (migrated from Bugzilla): URL: http://svn.apache.org/viewvc?rev=1376315&view=rev Modified: |
|
@milamberspace (migrated from Bugzilla): Modified: |
|
@milamberspace (migrated from Bugzilla): Added: |
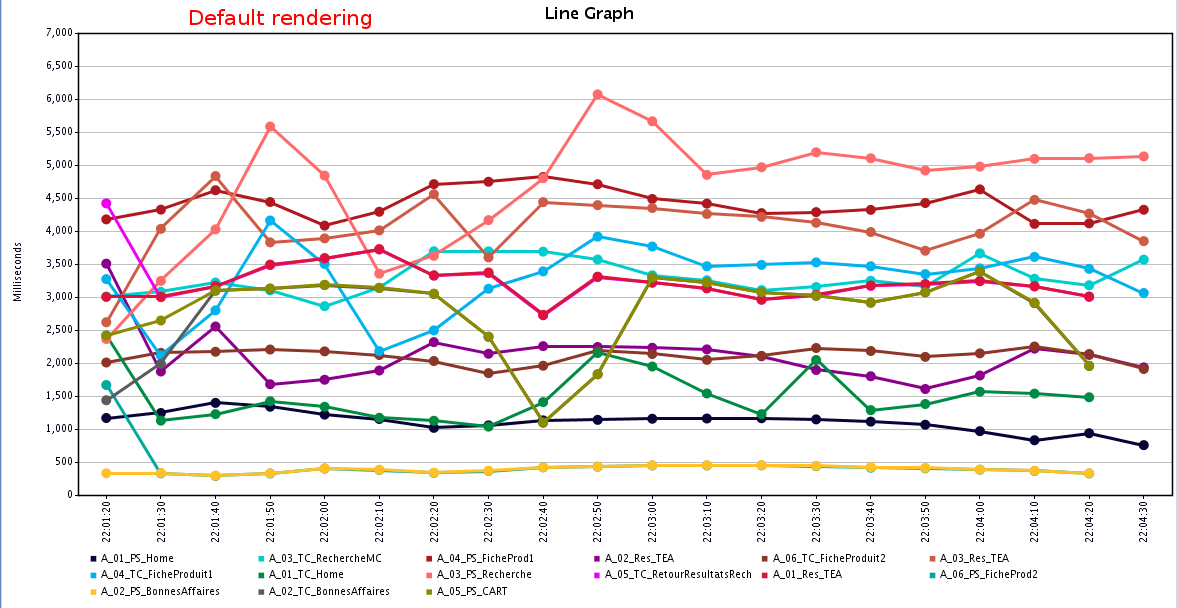
@milamberspace (Bug 53718):
I've just finish to develop a new visualizer which drawing a line graph showing the evolution of response time for a test (for each sampler).
It's based on jCharts API (already in JMeter libs).
In attachments, you can find some screenshots.
Questions:
I will commit the changes on svn, and continue to work on the documentation for this element.
Any comments are welcome.
Version: Nightly
Severity: normal
OS: All
The text was updated successfully, but these errors were encountered: