[SPARK-30209][SQL][WEB-UI] Display stageId, attemptId and taskId for max metrics in Spark UI. #26843
Conversation
|
ok to test |
|
Test build #115135 has finished for PR 26843 at commit
|
There was a problem hiding this comment.
Thanks for putting up the PR, I think this will help a lot in debugging and mapping SQL execs back to stages as well as finding the tasks using the max.
Really just a couple of nits.
Also look like a couple of tests are failing because they rely on the text output (min, med, max) so they need updated.
| @@ -111,7 +111,8 @@ object SQLMetrics { | |||
| // data size total (min, med, max): | |||
| // 100GB (100MB, 1GB, 10GB) | |||
| val acc = new SQLMetric(SIZE_METRIC, -1) | |||
| acc.register(sc, name = Some(s"$name total (min, med, max)"), countFailedValues = false) | |||
| acc.register(sc, name = Some(s"$name total (min, med, max(stageId (attemptId): taskId))"), | |||
There was a problem hiding this comment.
perhaps add a space after max before ( to see if more readable.
| def stringValue(metricsType: String, values: Array[Long]): String = { | ||
| */ | ||
| def stringValue(metricsType: String, values: Array[Long], maxMetrics: Array[Long]): String = { | ||
|
|
|
|
||
| // stringMetric = "(driver)" OR (stage $stageId(attempt $attemptId): task $taskId)) | ||
| val stringMetric = if (maxMetrics.isEmpty) "(driver)" else s"(stage ${maxMetrics(1)}" + | ||
| s"(attempt ${maxMetrics(2)}): task ${maxMetrics(3)})" |
There was a problem hiding this comment.
Please split into normal multiline if/else format since its on multiplelines.
if () {
} else {
}
can you try also adding a space between the stage number and (attempt. Again just to see if more readable
| val attemptId: Int, | ||
| val numTasks: Int, | ||
| val accumulatorIds: Set[Long]) { | ||
| val accumulatorIds: Map[Long, String]) { |
There was a problem hiding this comment.
might be nice to rename accumIdsToMetricType
| @@ -499,15 +522,31 @@ private class LiveStageMetrics( | |||
| } | |||
|
|
|||
| val metricValues = taskMetrics.computeIfAbsent(acc.id, _ => new Array(numTasks)) | |||
| metricValues(taskIdx) = value | |||
| } | |||
| metricValues(taskIdx) = (value) | |||
There was a problem hiding this comment.
remove the extra () on (value)
|
Thanks @tgravescs for reviewing this code. I have addressed review comments and fixed the unit tests and the Suites passed locally. Will wait for Test build results to check if there are any other issues. Please take another look. |
|
Test this please |
|
Test build #115269 has finished for PR 26843 at commit
|
|
Test build #115315 has finished for PR 26843 at commit
|
|
@nartal1 @tgravescs Sorry but I think this PR makes it hard to read the metrics. For example, the metrics of Any idea about improving the readability? |
|
@tgravescs This is really hard to read, to be honest. For most SQL users, they have no clue about the attemptId, stageId, taskID. We are exposing the internal details to end users. |
|
I'm definitely open to ideas on improving the readability. We could split it off into its own () after min,med,max for instance. I don't agree with your complaint that we are exposing internal details, that is all the UI does. Its for the user, spark dev, spark support people to be able to see the details and debug it as necessary. Another idea we could look at would be adding a radio button to disable it by default and then have it show up. I'm not sure how hard that would be but something we could investigate. |
…of sql metrics toggleable ### What changes were proposed in this pull request? This is another solution for `SPARK-31081` and #27849 . I added a checkbox which can toggle display of stageId/taskid in the SQL's DAG page. Mainly, I implemented the toggleable texts in boxes with HTML label feature provided by `dagre-d3`. The additional metrics are enclosed by `<span>` and control the appearance of the text. But the exception is additional metrics in clusters. We can use HTML label for cluster but layout will be broken so I choosed normal text label for clusters. Due to that, this solution contains a little bit tricky code in`spark-sql-viz.js` to manipulate the metric texts and generate DOMs. ### Why are the changes needed? It makes metrics harder to read after #26843 and user may not interest in extra info(stageId/StageAttemptId/taskId ) when they do not need debug. #27849 control the appearance by a new configuration property but providing a checkbox is more flexible. ### Does this PR introduce any user-facing change? Yes. [Additional metrics shown]  [Additional metrics hidden]  ### How was this patch tested? Tested manually with a simple DataFrame operation. * The appearance of additional metrics in the boxes are controlled by the newly added checkbox. * No error found with JS-debugger. * Checked/not-checked state is preserved after reloading. Closes #27927 from sarutak/SPARK-31081. Authored-by: Kousuke Saruta <sarutak@oss.nttdata.com> Signed-off-by: Gengliang Wang <gengliang.wang@databricks.com>
…of sql metrics toggleable ### What changes were proposed in this pull request? This is another solution for `SPARK-31081` and #27849 . I added a checkbox which can toggle display of stageId/taskid in the SQL's DAG page. Mainly, I implemented the toggleable texts in boxes with HTML label feature provided by `dagre-d3`. The additional metrics are enclosed by `<span>` and control the appearance of the text. But the exception is additional metrics in clusters. We can use HTML label for cluster but layout will be broken so I choosed normal text label for clusters. Due to that, this solution contains a little bit tricky code in`spark-sql-viz.js` to manipulate the metric texts and generate DOMs. ### Why are the changes needed? It makes metrics harder to read after #26843 and user may not interest in extra info(stageId/StageAttemptId/taskId ) when they do not need debug. #27849 control the appearance by a new configuration property but providing a checkbox is more flexible. ### Does this PR introduce any user-facing change? Yes. [Additional metrics shown]  [Additional metrics hidden]  ### How was this patch tested? Tested manually with a simple DataFrame operation. * The appearance of additional metrics in the boxes are controlled by the newly added checkbox. * No error found with JS-debugger. * Checked/not-checked state is preserved after reloading. Closes #27927 from sarutak/SPARK-31081. Authored-by: Kousuke Saruta <sarutak@oss.nttdata.com> Signed-off-by: Gengliang Wang <gengliang.wang@databricks.com> (cherry picked from commit 999c9ed) Signed-off-by: Gengliang Wang <gengliang.wang@databricks.com>
…of sql metrics toggleable ### What changes were proposed in this pull request? This is another solution for `SPARK-31081` and apache#27849 . I added a checkbox which can toggle display of stageId/taskid in the SQL's DAG page. Mainly, I implemented the toggleable texts in boxes with HTML label feature provided by `dagre-d3`. The additional metrics are enclosed by `<span>` and control the appearance of the text. But the exception is additional metrics in clusters. We can use HTML label for cluster but layout will be broken so I choosed normal text label for clusters. Due to that, this solution contains a little bit tricky code in`spark-sql-viz.js` to manipulate the metric texts and generate DOMs. ### Why are the changes needed? It makes metrics harder to read after apache#26843 and user may not interest in extra info(stageId/StageAttemptId/taskId ) when they do not need debug. apache#27849 control the appearance by a new configuration property but providing a checkbox is more flexible. ### Does this PR introduce any user-facing change? Yes. [Additional metrics shown]  [Additional metrics hidden]  ### How was this patch tested? Tested manually with a simple DataFrame operation. * The appearance of additional metrics in the boxes are controlled by the newly added checkbox. * No error found with JS-debugger. * Checked/not-checked state is preserved after reloading. Closes apache#27927 from sarutak/SPARK-31081. Authored-by: Kousuke Saruta <sarutak@oss.nttdata.com> Signed-off-by: Gengliang Wang <gengliang.wang@databricks.com>
What changes were proposed in this pull request?
SPARK-30209 discusses about adding additional metrics such as stageId, attempId and taskId for max metrics. We have the data required to display in LiveStageMetrics. Need to capture and pass these metrics to display on the UI. To minimize memory used for variables, we are saving maximum of each metric id per stage. So per stage additional memory usage is (#metrics * 4 * sizeof(Long)).
Then max is calculated for each metric id among all stages which is passed in the stringValue method. Memory used is minimal. Ran the benchmark for runtime. Stage.Proc time has increased to around 1.5-2.5x but the Aggregate time has decreased.
Why are the changes needed?
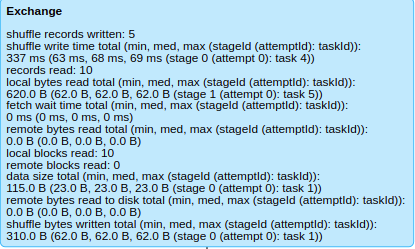
These additional metrics stageId, attemptId and taskId could help in debugging the jobs quicker. For a given operator, it will be easy to identify the task which is taking maximum time to complete from the SQL tab itself.
Does this PR introduce any user-facing change?
Yes. stageId, attemptId and taskId is shown only for executor side metrics. For driver metrics, "(driver)" is displayed on UI.

"Driver"

How was this patch tested?
Manually tested, ran benchmark script for runtime.