[SPARK-33033][WEBUI] display time series view for task metrics in history server #29908
Conversation
|
Can one of the admins verify this patch? |
|
thanks for the changes more ui changes to help debugging are great. I've been wanting something that does more timeline view to be able to see things like active executors as well as things like cached data throughout the application time since that goes away as well. the proposal here is the stats are still per application, correct? Not combining applications. |
|
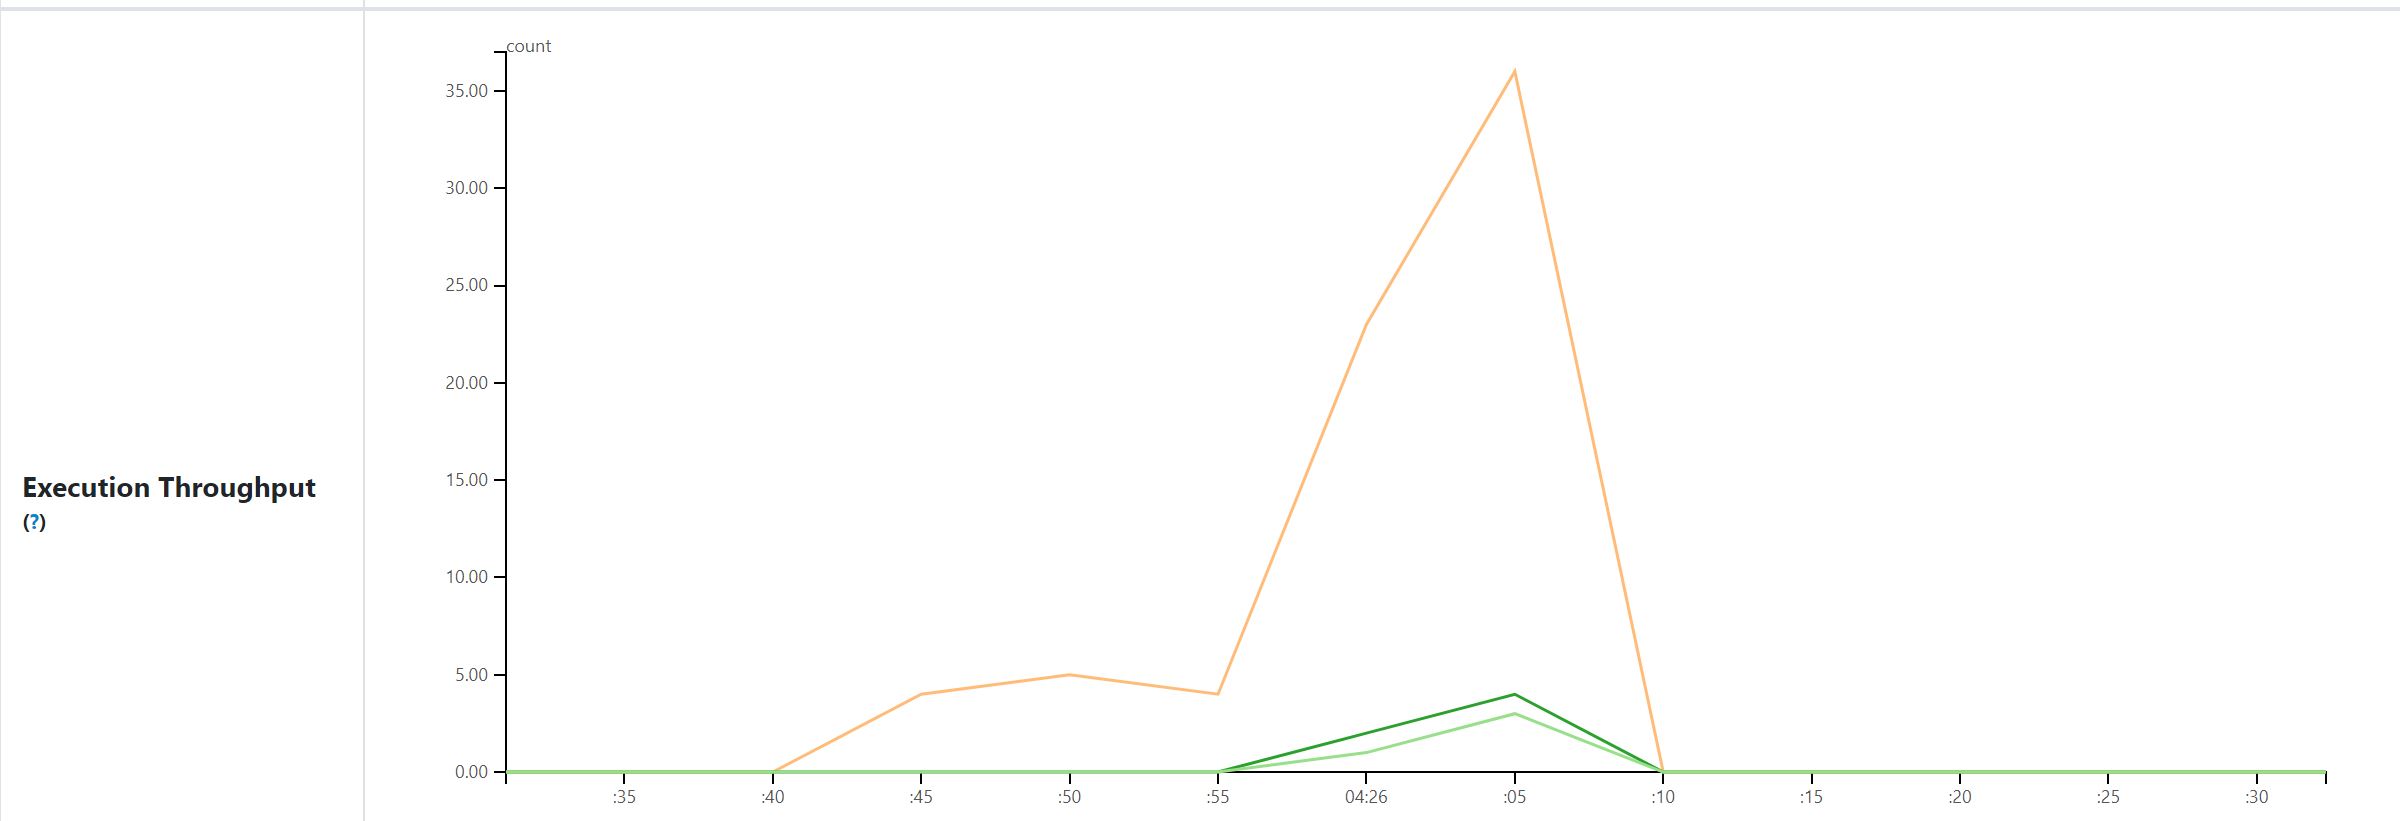
@tgravescs , thanks for your comments. The views here are all application level. You are right, "cluster throughput" is confusing, I use this as we run spark per cluster per application in our cases, but it's not suitable for other users. i think "Execution Throughput" here is better. if tasks start and finish within a minute, it's still shown here. for example task A started and finished within (t1 - 1 min, t1], it's value is recorded in data point t1. For long application, the default time range may be hours, all the graphs support zooming in so we can select small time rang for details (but minimum interval is not changed). for shorter application, we can use smaller aggregation period (this is a config for all applications rendered in HS), i also added config for this, for example "5 seconds" as below. Original data is from tasks metrics in event log, views above are based on my experience about using spark, welcome to any suggestions. If any other valuable view or aggregation data / dimension in your mind, we can talk about to see if it's easy to implement. |
|
We're closing this PR because it hasn't been updated in a while. This isn't a judgement on the merit of the PR in any way. It's just a way of keeping the PR queue manageable. |
What changes were proposed in this pull request?
Why are the changes needed?
Event log contains all tasks' metrics data, which are useful for performance debugging. By now, spark UI only displays final aggregation results, much information is hidden by this way. If spark UI could provide time series data view, it would be more helpful to performance debugging problems. We would like to build application statistics page in history server based on task metrics to provide more straight forward insight for spark application.

Below are views in application statistics page:
Execution Throughput: sum of completed tasks, stages, and jobs per minute. (associated stage Ids can be viewed in tool tip message.)
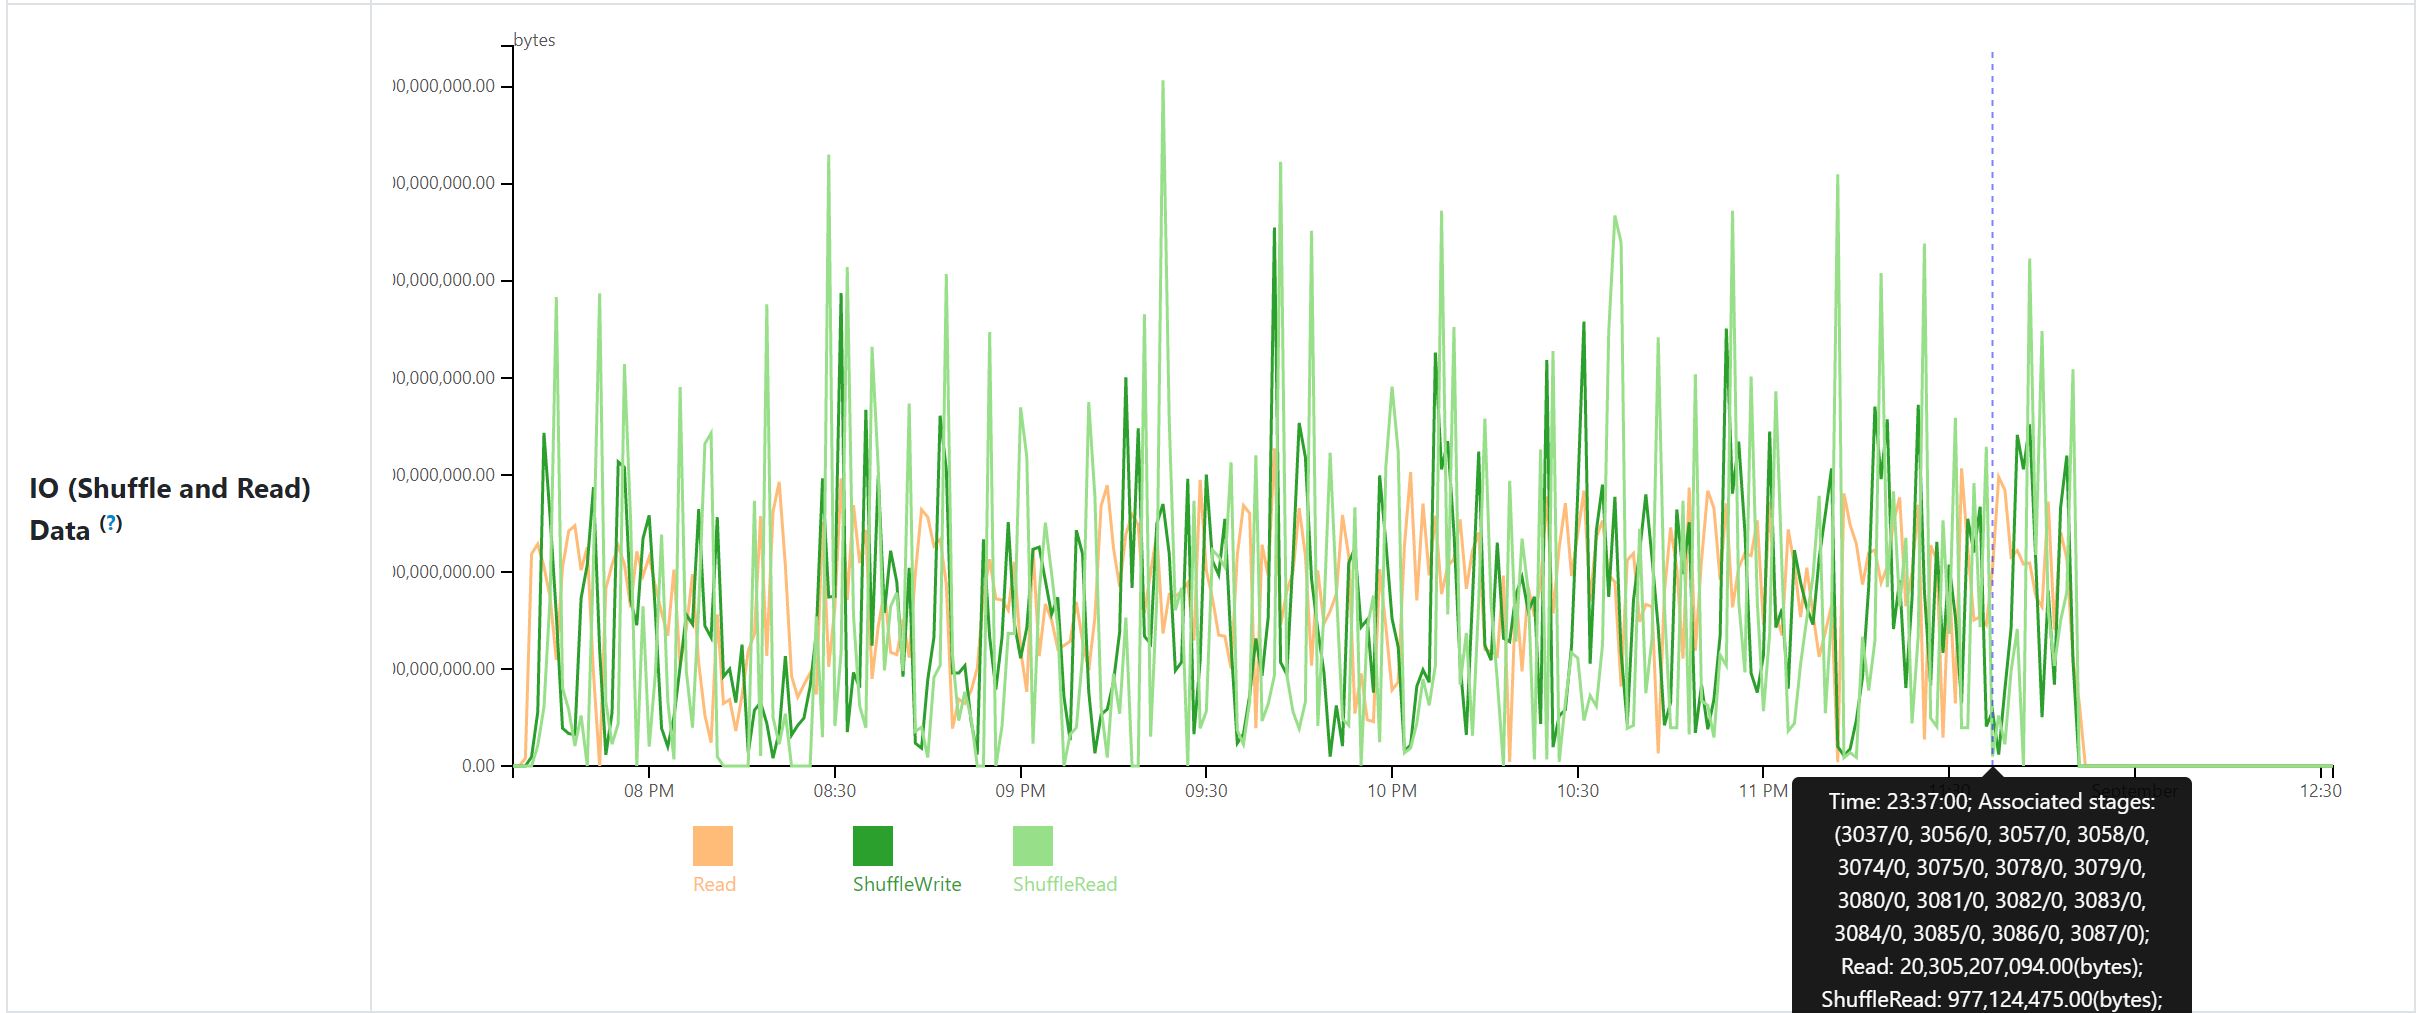
IO (Shuffle and Read) Data: sum of total shuffle read bytes, shuffle write bytes and read bytes per minute.
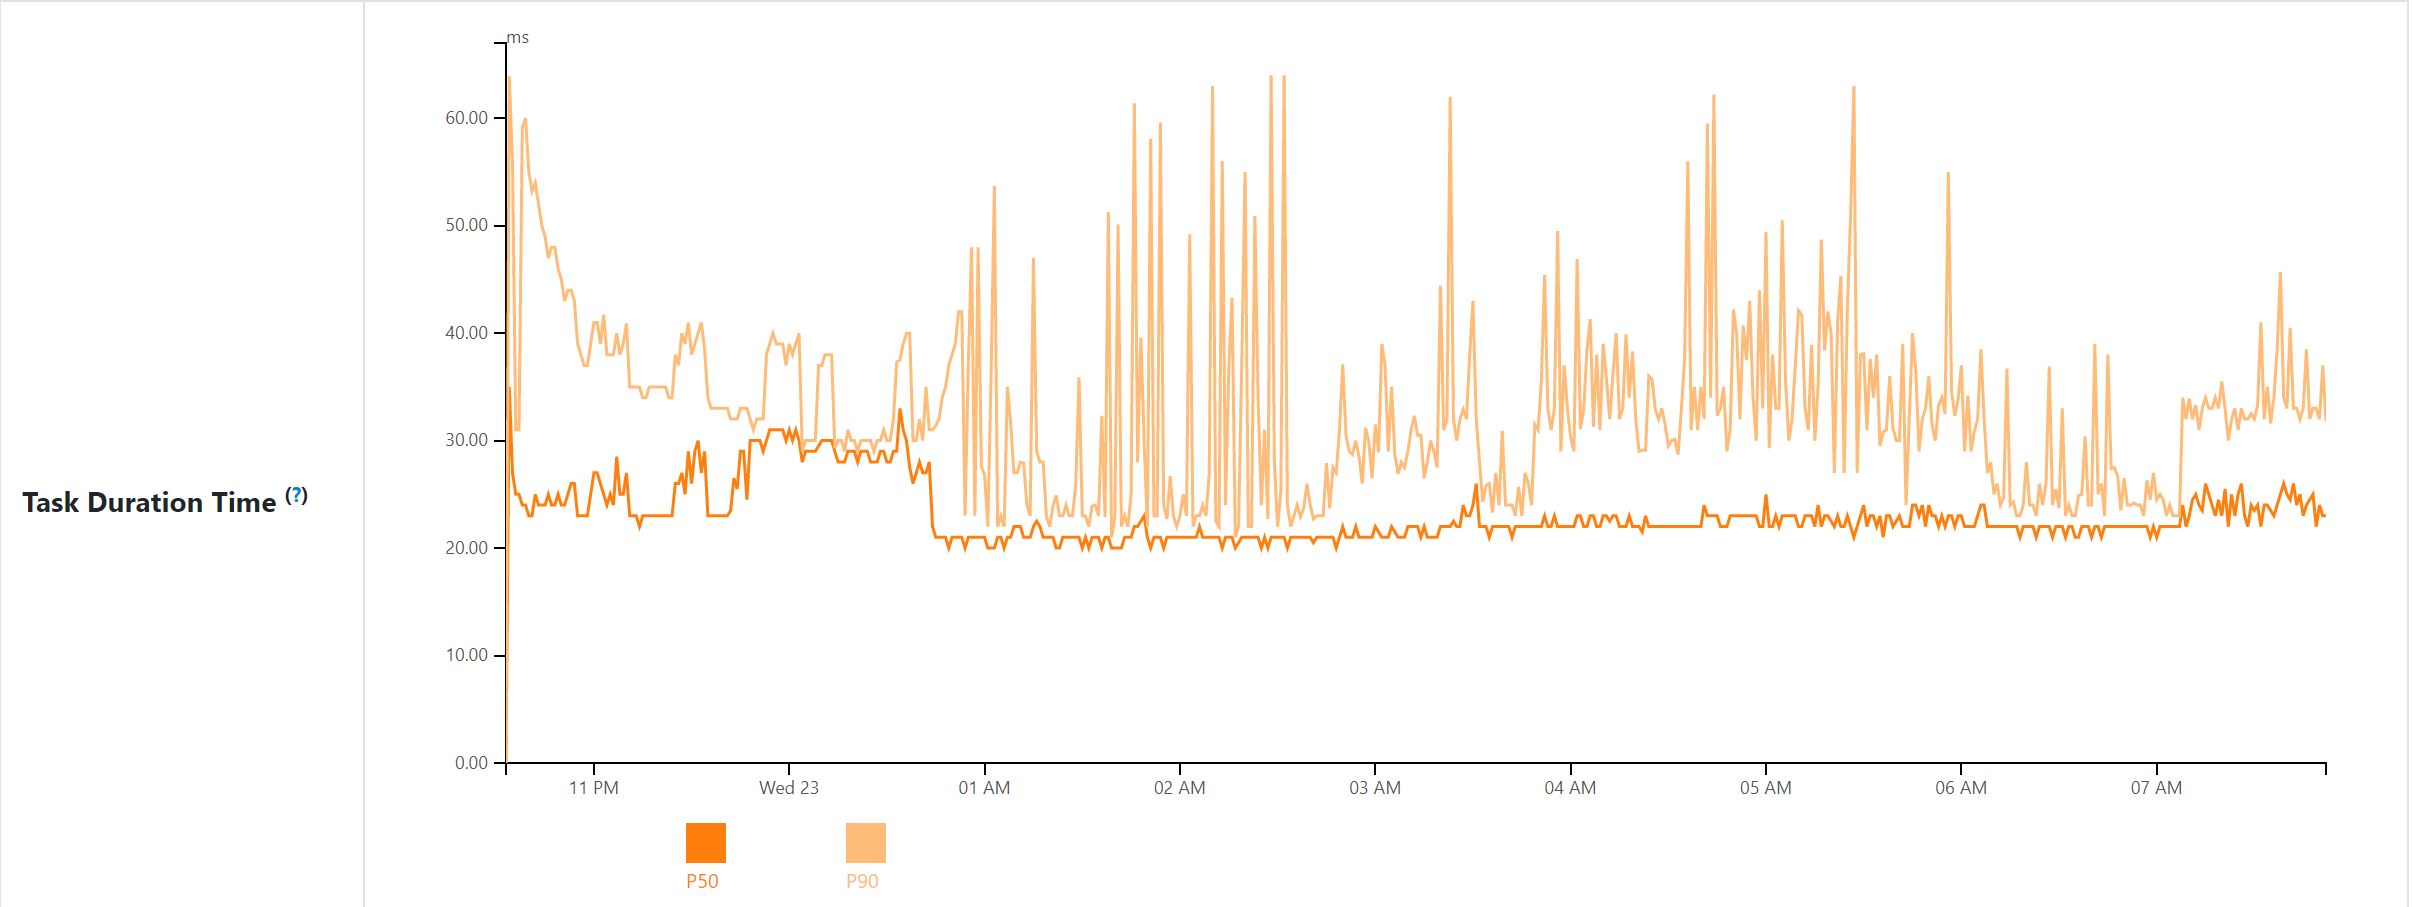
Task Duration Time: application level 50% and 90% percentile of task duration per minute.
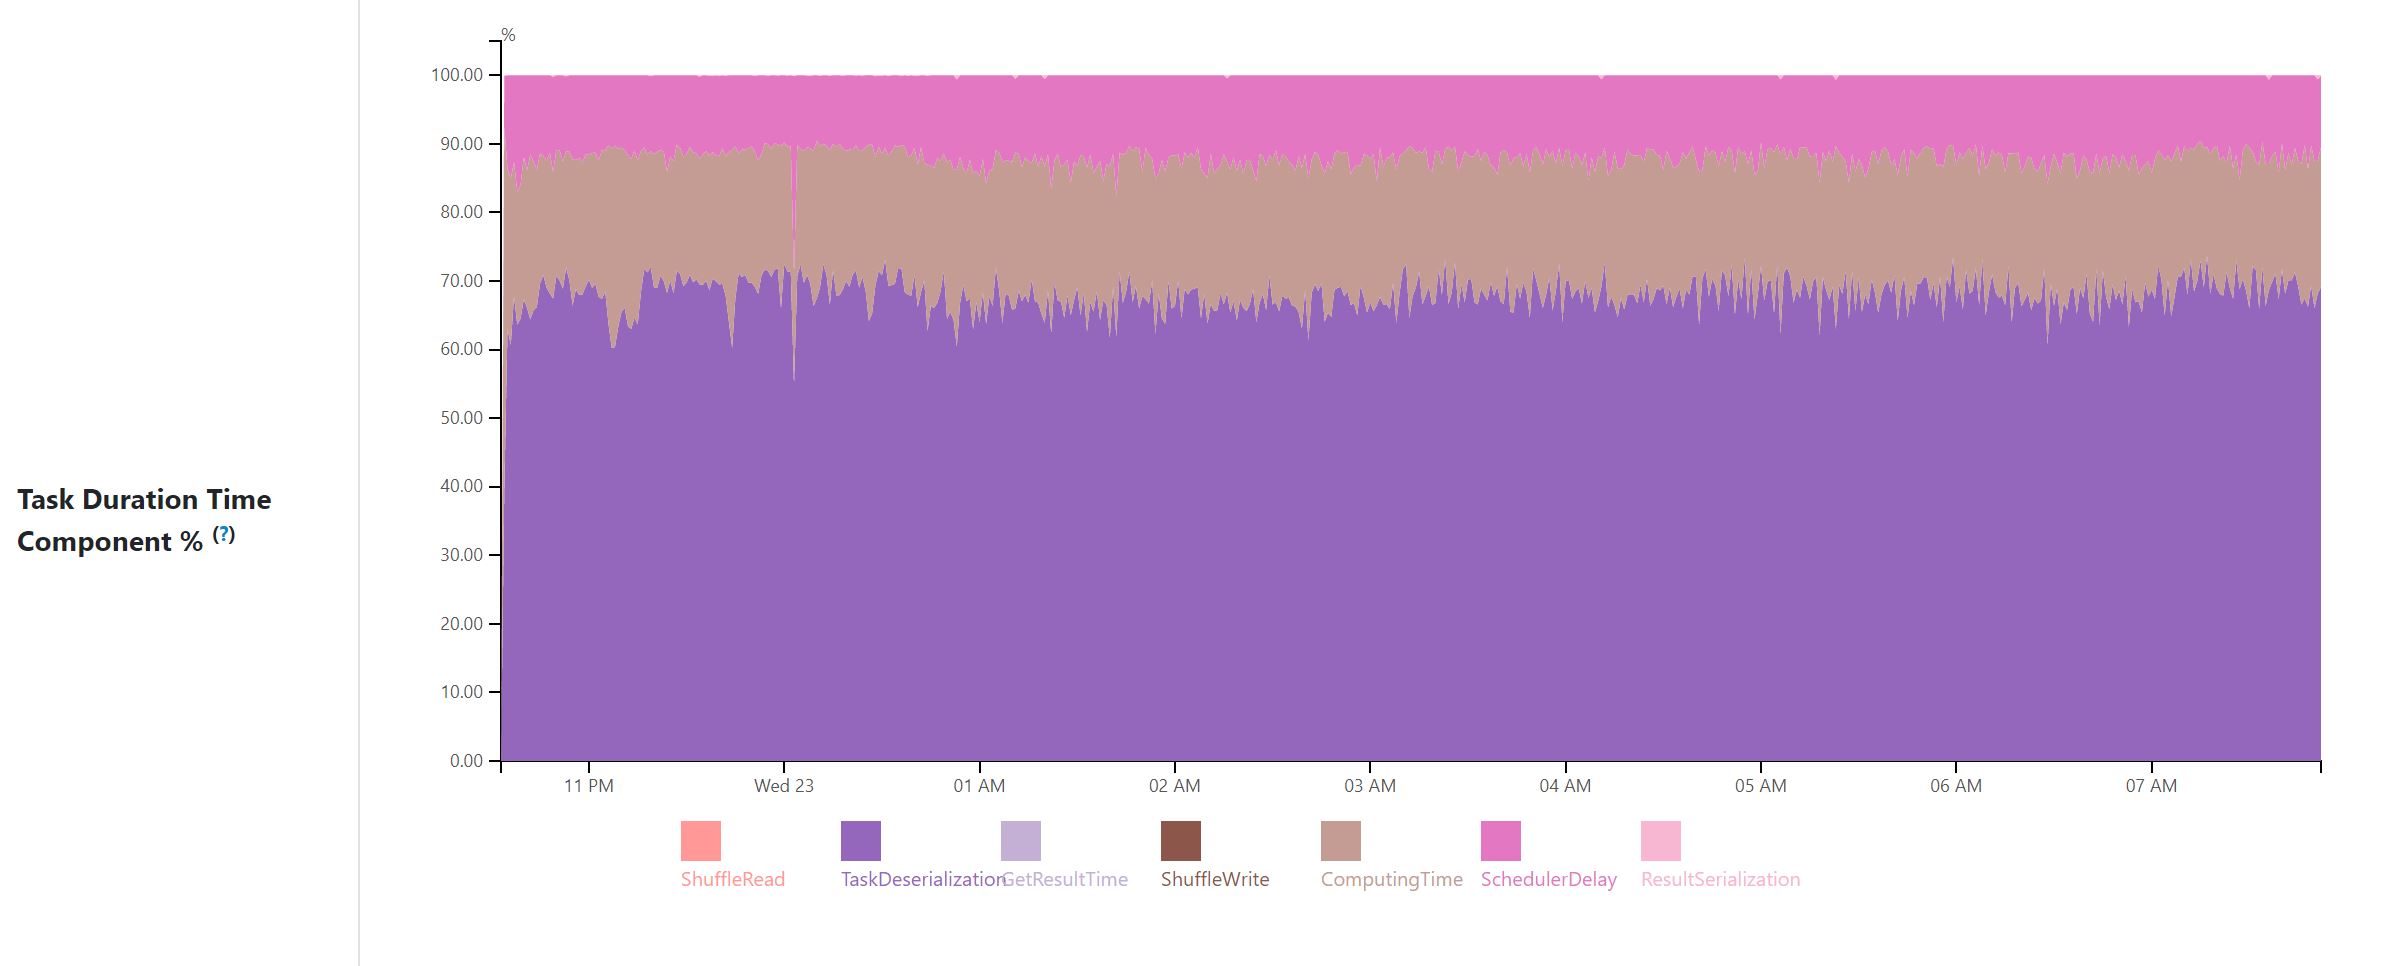
Task Duration Time Component %: percentage of scheduler delay, computing time, shuffle read, task deserialization, result serialization, shuffle write, get result time by task duration per minute.
Task JVM GC Time %: percentage of task JVM GC time by task duration per minute.
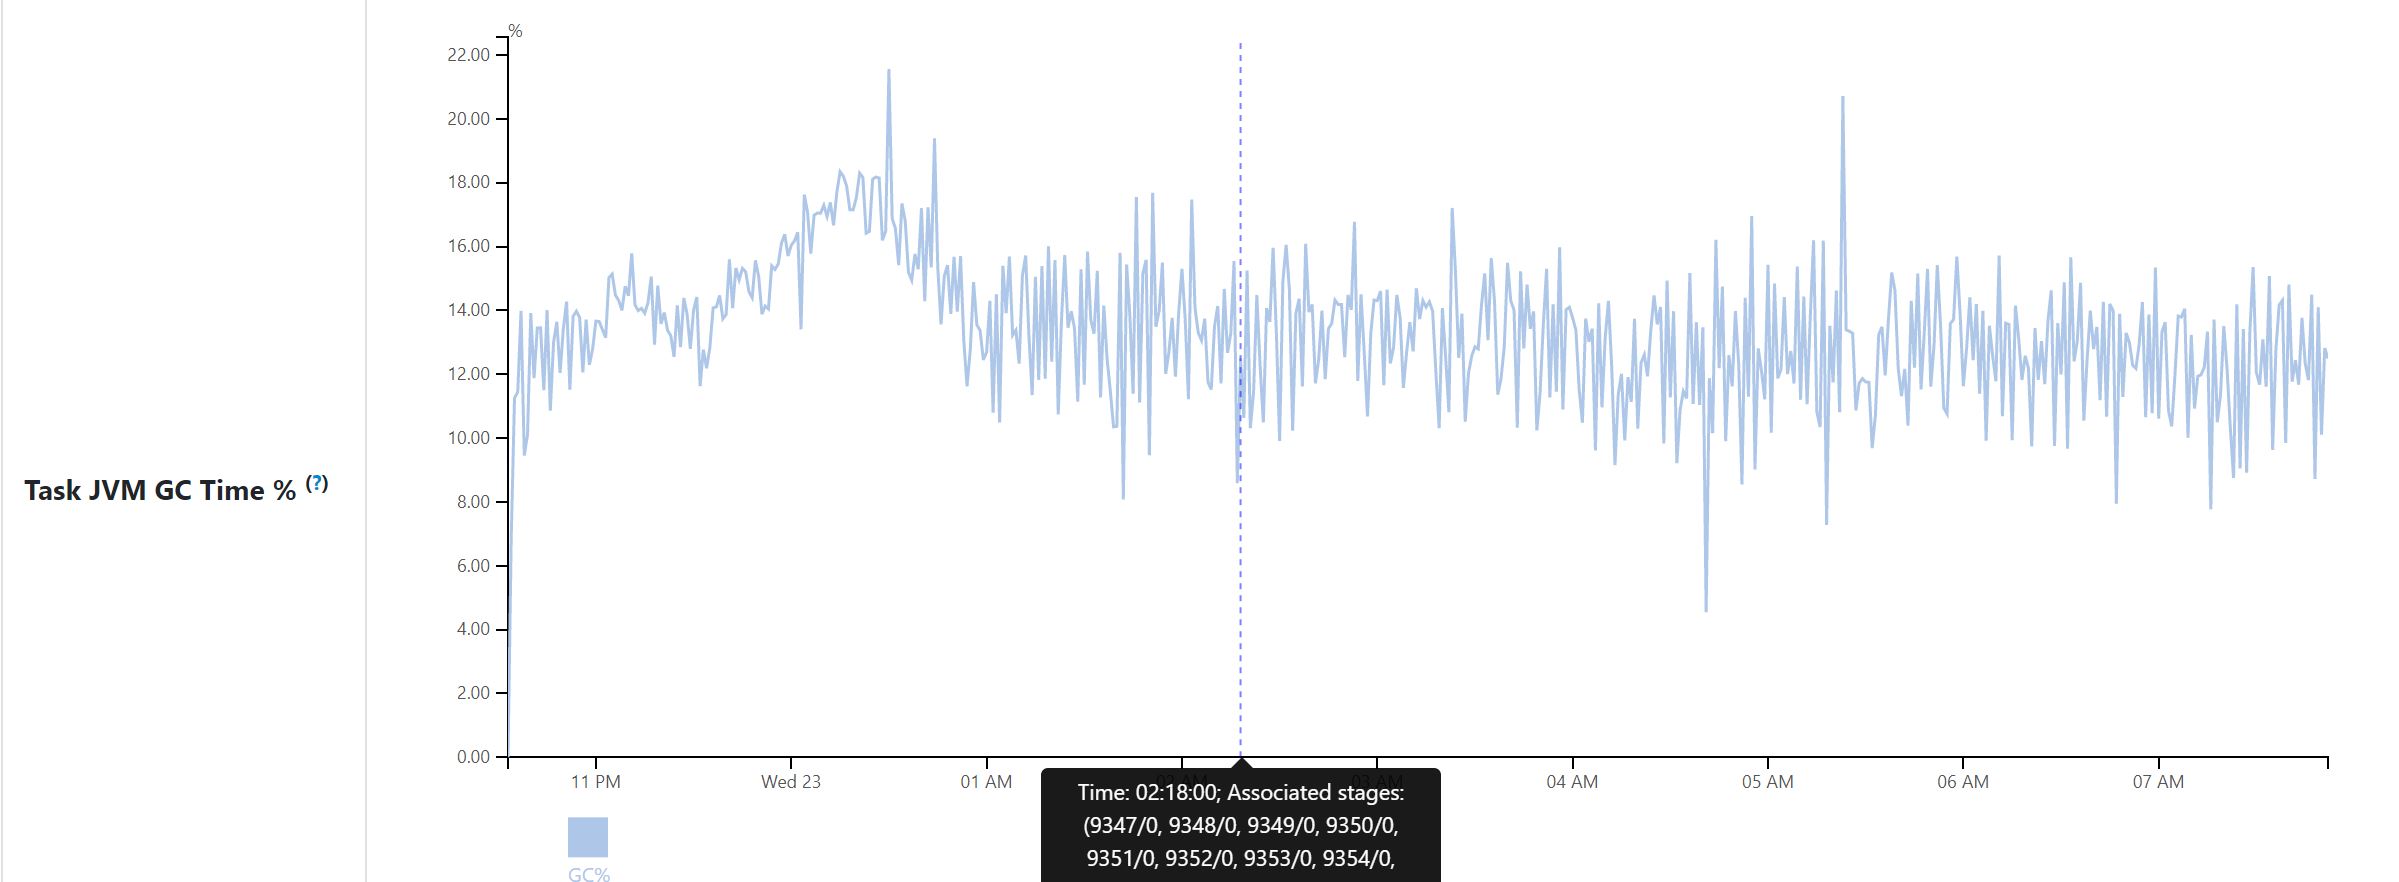
Application statistics page is only available in spark history server. Aggregated data is generated when parsing event log file and store in KVStore. Metrics data is aggregated to one data instance per minute (based on task finish time). For example, if task a finish time is in (t1 - 1minute, t1],a's data is added to data instance t1. This follows same approach of executors metrics.

From my test there is no much increasing for kv store size and replaying time. Here is my local test result. Impact to replay time may be little different for different applications, but it should be too big.
Does this PR introduce any user-facing change?
User facing change compared to master: Add application statistics page under jobs tab and new page link in jobs page.
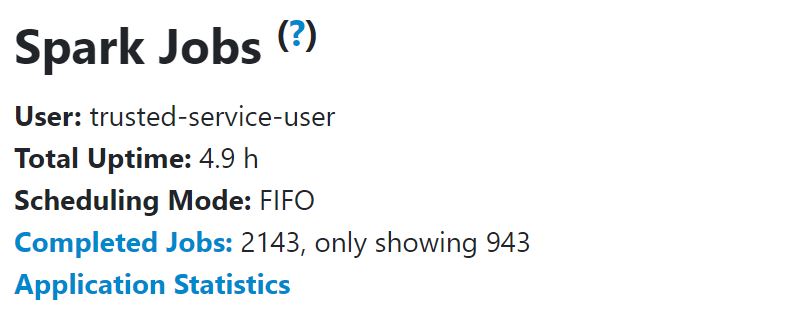
Entry point:
Application statistics page:

How was this patch tested?