fix: Displaying filter indicators #12252
Conversation
Codecov Report
@@            Coverage Diff             @@
##           master   #12252      +/-   ##
==========================================
- Coverage   66.29%   64.08%   -2.22%
==========================================
  Files        1015      486     -529
  Lines       49554    29921   -19633
  Branches     5079        0    -5079
==========================================
- Hits        32854    19176   -13678
+ Misses      16562    10745    -5817
+ Partials      138        0     -138
Flags with carried forward coverage won't be shown. Click here to find out more. Continue to review full report at Codecov.
|

|
@agatapst I can see situation where child filters are not displayed as set when I use them: |


|
After second test it is ok! no issue from above message |
There was a problem hiding this comment.
LGTM!
After

Before

NOTE
- This is only Product and QA approval with NO code reviews
- This approval indicates that all UI changes meet product requirements, no noticeable regression
- This approval gives the green light to code review, thus saving the PMC's effort from reviewing the code repeatedly before the PR is ready
- Please do NOT merge this PR without at least one code review approval from PMC member
- Please do NOT merge PRs in(Explore and Dashboard) without Product and QA approval
| chartId, | ||
| dashboardFilters, | ||
| datasources, | ||
| charts, | ||
| ); | ||
|
|
||
| const nativeIndicators = selectNativeIndicatorsForChart(nativeFilters); | ||
|
|
||
| const indicators = nativeIndicators.reduce((acc, indicator) => { |
There was a problem hiding this comment.
I would suggest using uniqBy here instead of reduce.
There was a problem hiding this comment.
On second thought, you'd probably have to use uniqWith, not uniqBy.
There was a problem hiding this comment.
Thanks, that's a nice tip!
|
Pinged @suddjian for feedback, and he left some seconds before I approved! I think it's good advice if you don't mind the quick tweak. |
843df37
to
9d02034
Compare
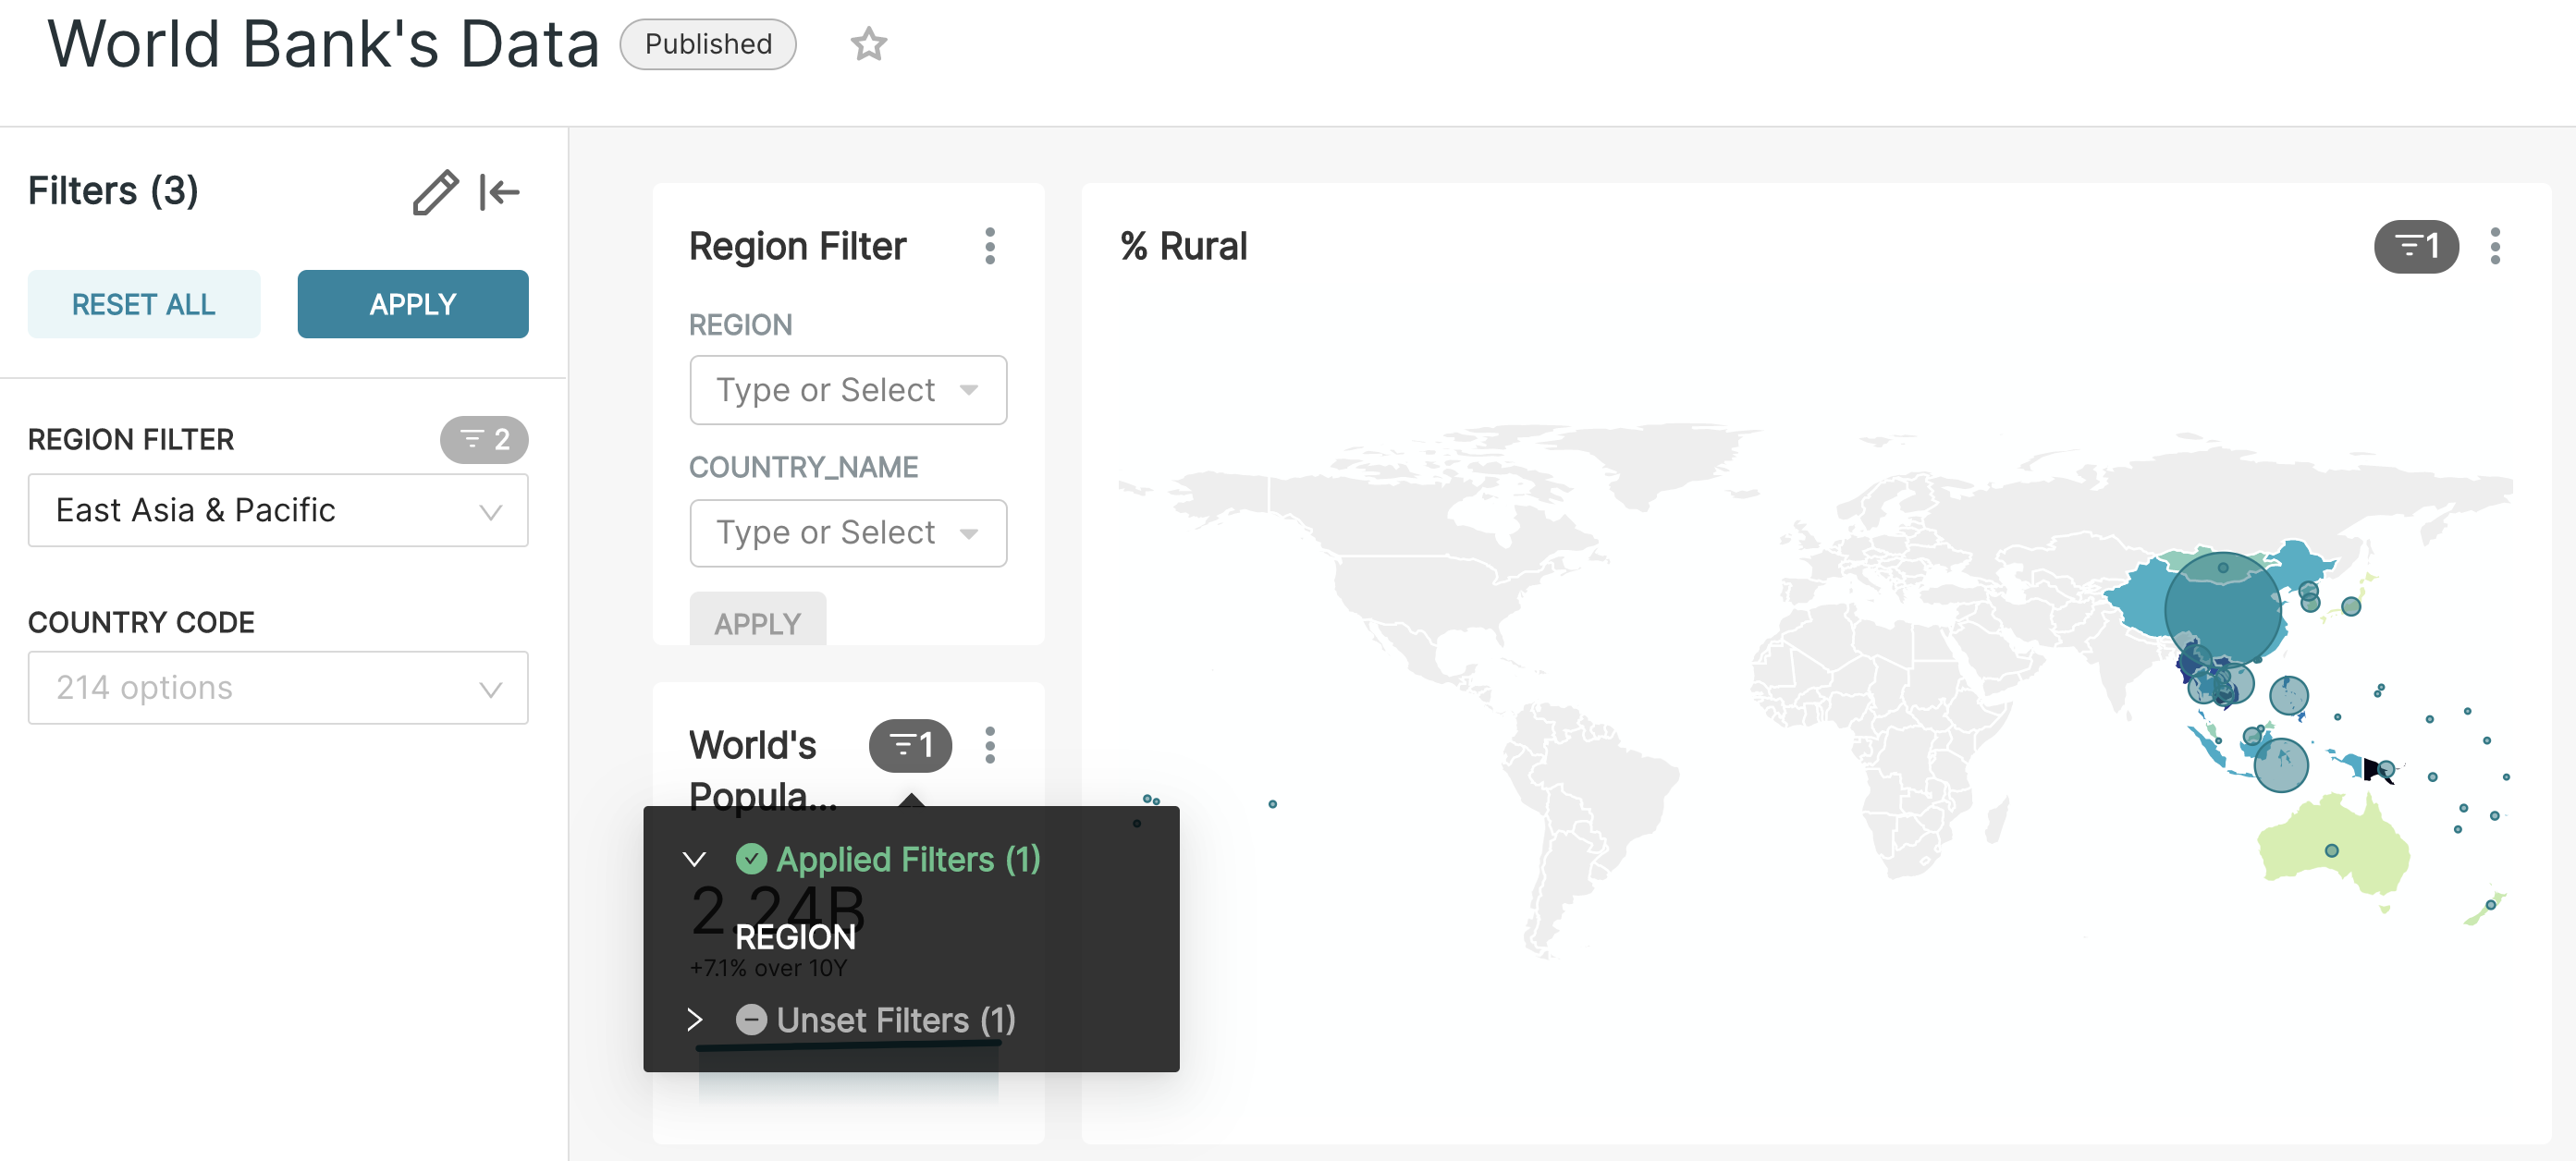
SUMMARY
The problem was that chart indicator did not match native filter indicator and this PR fixes that.
Be aware that there is still filter component next to the charts. It is separated from the native filters, but has impact on the same charts. It also counts as "Applied filter".
BEFORE/AFTER SCREENSHOTS OR ANIMATED GIF
Before:

After:


TEST PLAN
Verify manually. Go to
config.pyand set"DASHBOARD_NATIVE_FILTERS": TrueGo to a dashboard and create Native Filter.
Click an indicator presented on the charts (dark gray pill with a number). See if the information matches your filter.
ADDITIONAL INFORMATION
cc @junlincc @villebro
@adam-stasiak could you please test?