stat_fit_glance() for quantreg:rq() #1
Comments
stat_fit_glance() for quantreg:rq()|
Even if 'stat_fit_glance' was only compatible with one quantile being calculated (e.g. 'quantiles=0.50'), that would be helpful. I'm guessing that 'rq' outputting multiple quantile results could be difficult to handle neatly, so in a golly call, doing x seperate 'stat_fit_glance' calls for your desired x different quantiles would be a pretty good work around. |
|
For single quantiles this is solved in version 0.3.8. Be aware that for parameter estimates one needs to use Please look at the version at this link as I found a bug in this vignette in the version submitted to CRAN. |
|
|
|
Hi Pedro, I tried installing as per your suggestion on StackOverflow. |
|
Here are the resulting messages from install - some Rd warnings (?) specific to my computer? Installing ggpmisc and selecting update all caused an issue with "fansi" not installing (similar to "vctrs" problem above). Resolved with deletion of "fansi", restart R and repeat. On install, an Rd warning here too - may be of no importance. |
|
Hi Pedro, I've run the code from your documentation, and resulting graphs look really good to me! Documentation also looks good, though for stat_quant_eq {ggpmisc} an unneeded comma gives a visual warning in Rstudio IDE "missing argument to function call" - it doesn't stop the code working fine for me though. Do you think the documentation should read quantiles = c("0.25, 0.5, 0.75)" since that is the default? I note that documentation for geom_quantile {ggplot2} has the default for stat_quantile() as |
|
I've run some code with some of my data. It looks to be working quite well, but I found this edge case, where when I split into groups, The quantiles will plot, but the equations do not. appear in plot 2. Any ideas? I can pass data to you privately if need be. Error message for plot 2
|

|
Many thanks! It is curious that quantile regression seems to be more frequently used in economics than in biology. It seems to me a very useful tools whenever there are outliers. |
|
@markbneal I will submit 'ggpmisc' to CRAN today. I smoothed some rough edges but surely improvements will be possible. I now close this issue but if you find that something is not working please reopen this issue or create a new one. Once again, thanks! |
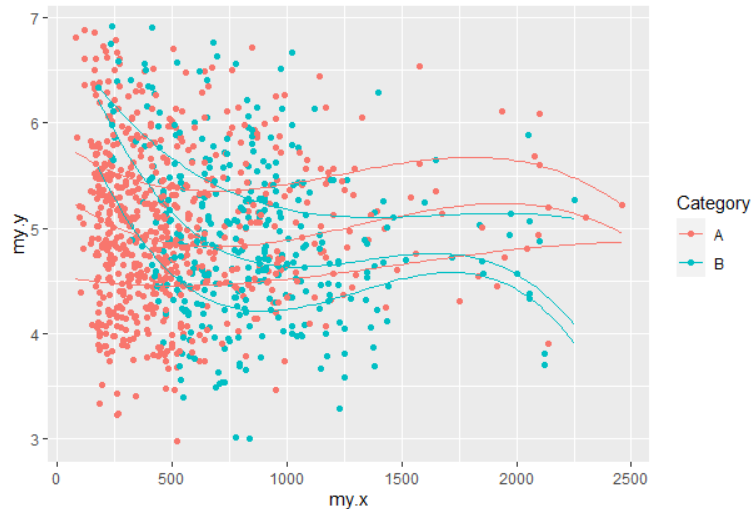
Yes it is! Here's a plot I've used, showing how economies of size differ (or not) based on quantiles (i.e the quantile represents cost-efficient performance conditional on size).
|

Fix GH-1 Add comment stating that list columns in data returned by stats like stat_poly_eq() do not work together with facets.
https://stackoverflow.com/questions/65695409/is-there-a-neat-approach-to-label-a-ggplot-plot-with-the-equation-and-other-stat
This would be usable with
ggplot2::geom_quantile()The text was updated successfully, but these errors were encountered: