Open-Source Admin Dashboard coded in Django Framework by AppSeed App Generator - Features:
- REST API
- GraphQL API
- Charts Samples - Bar chart, Line chart
- DataTables - pagination, search, inline edit (via Ajax)
- Social Login via AllAuth (Google and Github)
- Unitary Tests
- Documentation (this file) - Full docs are WIP.
🚀
PROMO: Junior Developers Starter KIT85%OFF
The package includes a rock-solid collection of premium assets (Kits & Dashboards) that can be used to build eye-catching portfolios and web apps in no time.

- Install
django-import-exportpackage to import data form csv, xls and etc file to table.
$ pip install django-import-exportThen add this package to INSTALLED_APPS in settings.py. Now you can change the admin section of each model and add this feature. so you can easily import the data to your table. Please add this package in requirements.txt
How to use it
To use REST in Django, install djangorestframework:
$ pip install djangorestframework djangorestframework-simplejwtIn settings.py add rest_framework in INSTALLED_APPS
INSTALLED_APPS = [
    ...
    'rest_framework',
]
Then add django rest framework config in settings.py:
REST_FRAMEWORK = {
    'PAGE_SIZE': 5,
    'DEFAULT_PAGINATION_CLASS': 'rest_framework.pagination.LimitOffsetPagination',
    'COERCE_DECIMAL_TO_STRING': False,
}
Please add this package in requirements.txt
Database/table structure
Create two models to display the information in REST API, which includes Visit & Traffic:
from django.db import models

class Visit(models.Model):
    BOUNCE_RATE_TYPE_UP = 1
    BOUNCE_RATE_TYPE_DOWN = 2

    BOUNCE_RATE_TYPE_CHOICES = [
        (BOUNCE_RATE_TYPE_UP, 'up'),
        (BOUNCE_RATE_TYPE_DOWN, 'down')
    ]

    page_name        = models.CharField(max_length=255)
    visitors         = models.PositiveIntegerField()
    unique_users     = models.PositiveIntegerField()
    bounce_rate      = models.FloatField()
    bounce_rate_type = models.SmallIntegerField(choices=BOUNCE_RATE_TYPE_CHOICES)
    created_time     = models.DateTimeField(db_index=True)
    updated_time     = models.DateTimeField(auto_now=True)

    class Meta:
        verbose_name = 'visit'
        verbose_name_plural = 'visits'

class Traffic(models.Model):
    RATE_TYPE_UP = 1
    RATE_TYPE_DOWN = 2

    RATE_TYPE_CHOICES = [
        (RATE_TYPE_UP, 'up'),
        (RATE_TYPE_DOWN, 'down')
    ]

    referral     = models.CharField(max_length=50)
    visitors     = models.PositiveIntegerField()
    rate         = models.FloatField()
    rate_type    = models.SmallIntegerField(choices=RATE_TYPE_CHOICES)
    created_time = models.DateTimeField(db_index=True)
    updated_time = models.DateTimeField(auto_now=True)

    class Meta:
        verbose_name = 'traffic'
        verbose_name_plural = 'traffics'
Files (that implements the feature)
- Create serializers.py file. Then add serializers
TrafficSerializerandVisitSerializeras follows:
from rest_framework import serializers
from app.models import Traffic, Visit

class TrafficSerializer(serializers.ModelSerializer):
    class Meta:
        model = Traffic
        fields = '__all__'

class VisitSerializer(serializers.ModelSerializer):
    class Meta:
        model = Visit
fields = '__all__'- In file views.py add the
TrafficViewSetandVisitViewSetViewSets.
from rest_framework.viewsets import ModelViewSet
from app.models import Traffic, Visit
from app.serializers import TrafficSerializer, VisitSerializer


class TrafficViewSet(ModelViewSet):
    serializer_class = TrafficSerializer
    queryset = Traffic.objects.all()
    http_method_names = ['get']


class VisitViewSet(ModelViewSet):
    serializer_class = VisitSerializer
    queryset = Visit.objects.all()
http_method_names = ['get']- In file urls.py, add the following urls:
from rest_framework import routers
from app.views import TrafficViewSet, VisitViewSet

router = routers.SimpleRouter()
router.register(r'api/v1/traffics', TrafficViewSet, basename="traffics")
router.register(r'api/v1/visits', VisitViewSet, basename="visits")

urlpatterns = router.urls + [
...
]
Now your REST APIs is ready. And you can use it.
API structure
The traffics and visits APIs structure follow the Django REST framework:
{
    "count": "Total Item count",
    "next": "Next Link",
    "previous": "Previous Link",
    "results": "Serialized information in the form of a list"
}
How to add data
In Django admin, you can import data for the Visits and Traffics sections.
To do this just click on IMPORT button in each section, then select your csv, xls or etc file and submit it.

How to consume API
- To use AIPs, you can import the sample POSTMAN
How to use it
To use GraphQL in Django install graphene-django:
$ pip install graphene-djangoIn settings.py add graphene-django in INSTALLED_APPS
INSTALLED_APPS = [
    ...
    'graphene_django',
]
Please add this package in requirements.txt
Database/table structure
We created two models to display the information in GraphQL API, which includes Order & Sale:
from django.db import models

class Order(models.Model):
    count        = models.PositiveIntegerField()
    amount       = models.FloatField(db_index=True)
    product_name = models.CharField(max_length=40, db_index=True)
    created_time = models.DateTimeField(db_index=True)
    updated_time = models.DateTimeField(auto_now=True)

    class Meta:
        verbose_name = 'order'
        verbose_name_plural = 'orders'


class Sale(models.Model):
    amount       = models.FloatField(db_index=True)
    product_name = models.CharField(max_length=40, db_index=True)
    created_time = models.DateTimeField(db_index=True)
    updated_time = models.DateTimeField(auto_now=True)

    class Meta:
        verbose_name = 'sale'
        verbose_name_plural = 'sales'
Files (that implements the feature)
- Create the schema.py file in your app. Then add the following classes to make your own schema:
These classes include monthly reports on sales and orders.
import graphene
from django.db.models import Count, Sum
from django.db.models.functions import TruncMonth
from app.models import Order, Sale


class OrderMonthReportType(graphene.ObjectType):
    month = graphene.Int()
    total = graphene.Int(name='total')

class SalesMonthReportType(graphene.ObjectType):
    month = graphene.Int()
    total_amount = graphene.Float(name='total_amount')

class Query(graphene.ObjectType):
    orders_month_report = graphene.List(
        OrderMonthReportType,
        name='orders_month_report'
    )

    sales_month_report = graphene.List(
        SalesMonthReportType,
        name='sales_month_report'
    )

    def resolve_orders_month_report(self, info, **kwargs):
        queryset = Order.objects.annotate(
            date=TruncMonth('created_time')
        ).values('date').annotate(total=Count('id')).values('date', 'total').order_by('date')

        report = {month: 0 for month in range(1, 13)}
        for order_month in queryset:
            report[order_month['date'].month] += order_month['total']
        report = sorted(report.items())

        res = []
        for month, total in report:
            res.append({'month': month, 'total': total})

        return res

    def resolve_sales_month_report(self, info, **kwargs):
        queryset = Sale.objects.annotate(
            date=TruncMonth('created_time')
        ).values('date').annotate(total_amount=Sum('amount')).values('date', 'total_amount').order_by('date')

        report = {month: 0 for month in range(1, 13)}
        for order_month in queryset:
            report[order_month['date'].month] += round(order_month['total_amount'], 2)
        report = sorted(report.items())

        res = []
        for month, total_amount in report:
            res.append({'month': month, 'total_amount': total_amount})

return res- To receive data through any app, you need to create a schema.py file in the main app. In this project, the name of the main app is
core. So in this part, I created a scheam.py:
import graphene
from app.schema import Query as app_query

class Query(app_query):
    pass

schema = graphene.Schema(query=Query)- Then add the url in urls.py in
mainapp:
from django.contrib import admin
from django.urls import path
from django.views.decorators.csrf import csrf_exempt
from graphene_django.views import GraphQLView
from core.schema import schema

urlpatterns = [
    path('admin/', admin.site.urls),

    # This is our GraphQL URL
    path('graphql/', csrf_exempt(GraphQLView.as_view(graphiql=True, schema=schema))),
]
We enabled
graphiqlto run queries withgraphiql=True
- Now you can open
http://localhost:8000/graphql/in your browser and run your queries.
Sample Query:
{
  orders_month_report{
    total
    month
  }
  sales_month_report{
    total_amount
    month
  }
}
API structure
The orders and sales APIs structure follow the Django GraphQL:
{
  "data": {
    "orders_month_report": [],
    "sales_month_report": []
  }
}
How to add data
In Django admin, you can import data for the Orders and Sales sections.
To do this just click on IMPORT button in each section, then select your csv, xls or etc file and submit it.
How to consume API
- To use AIPs, you can import the sample POSTMAN
For this part, we use GraphQL API and Jquery (AJAX) to fetch data and show.
Database/table structure
- In this section, we use the previous models, ie
OrderandSale.
Files (that implements the feature)
- Create a new js file (anywhere you want). named dashboard.js and add it in the page you want to fetch and show.
- Run AJAX when the page loaded. for doing this I made a function then I call it anywhere:
function GraghQLAjax(params) {
    var query = JSON.stringify({
        query: `query {
            orders_month_report {
                month
                total
            }
            sales_month_report {
                month
                total_amount
            }
        }`
    });

    $.ajax({
        method: 'POST',
        url: '/graphql/',
        data: query,
        contentType: 'application/json',
        success: function (data) {
            var months = ['Jan', 'Feb', 'Mar', 'Apr', 'May', 'Jun', 'Jul', 'Aug', 'Sep', 'Oct', 'Nov', 'Dec'];

            // sales chart
            var sales_chart_data = [];
            $.each(data.data.sales_month_report, function (index, obj) {
                sales_chart_data.push(obj.total_amount);
            });
            SalesChart(sales_chart_data, months);

            // orders chart
            var orders_chart_data = [];
            $.each(data.data.orders_month_report, function (index, obj) {
                orders_chart_data.push(obj.total);
            });
            OrderChart(orders_chart_data, months);

        },
        error: function () {
            alert('Error occurred');
        }
    });
}

// charts function

// Line chart
function SalesChart(data, labels) {
    // Variables
    var $chart = $('#chartSales');

    var salesChart = new Chart($chart, {
        type: 'line',
        options: {
            scales: {
                yAxes: [{
                    gridLines: {
                        lineWidth: 1,
                        color: Charts.colors.gray[900],
                        zeroLineColor: Charts.colors.gray[900]
                    },
                    ticks: {
                        callback: function (value) {
                            if (!(value % 10)) {
                                return '$' + value;
                            }
                        }
                    }
                }]
            },
            tooltips: {
                callbacks: {
                    label: function (item, data) {
                        var label = data.datasets[item.datasetIndex].label || '';
                        var yLabel = item.yLabel;
                        var content = '';

                        if (data.datasets.length > 1) {
                            content += '<span class="popover-body-label mr-auto">' + label + '</span>';
                        }

                        content += '<span class="popover-body-value">$' + yLabel + '</span>';
                        return content;
                    }
                }
            }
        },
        data: {
            labels: labels,
            datasets: [{
                label: 'Performance',
                data: data
            }]
        }
    });

    // Save to jQuery object
    $chart.data('chart', salesChart);
}

// Bar chart
function OrderChart(data, labels) {
    var $chart = $('#chartOrders');

    var ordersChart = new Chart($chart, {
        type: 'bar',
        options: {
            scales: {
                yAxes: [{
                    gridLines: {
                        lineWidth: 1,
                        color: '#dfe2e6',
                        zeroLineColor: '#dfe2e6'
                    },
                    ticks: {
                        callback: function (value) {
                            if (!(value % 10)) {
                                //return '$' + value + 'k'
                                return value
                            }
                        }
                    }
                }]
            },
            tooltips: {
                callbacks: {
                    label: function (item, data) {
                        var label = data.datasets[item.datasetIndex].label || '';
                        var yLabel = item.yLabel;
                        var content = '';

                        if (data.datasets.length > 1) {
                            content += '<span class="popover-body-label mr-auto">' + label + '</span>';
                        }

                        content += '<span class="popover-body-value">' + yLabel + '</span>';

                        return content;
                    }
                }
            }
        },
        data: {
            labels: labels,
            datasets: [{
                label: 'Sales',
                data: data
            }]
        }
    });

    // Save to jQuery object
    $chart.data('chart', ordersChart);
}
Now call
GraghQLAjaxfunction whatever you want. In this example, after fetching data from GraphQL, the required params sent to the related function to show the data on charts.
In this section, you can search, edit and delete the transactions. The added features of this datatable are:
- Paginated information (transaction page) with usable controls: PREV, 1,2,3., NEXT
- Search box to filter
- Delete row control
- edit cel data on double click and ENTER on confirm.
Database/table structure
Create the Transaction model to show data in the datatable:
from django.db import models

class Transaction(models.Model):
    bill_for = models.CharField(max_length=100)
    issue_date = models.DateField()
    due_date = models.DateField()
    total = models.DecimalField(max_digits=10, decimal_places=2)

    status = models.CharField(max_length=10)

    created_time = models.DateTimeField(auto_now_add=True)
    updated_time = models.DateTimeField(auto_now=True)

    class Meta:
        verbose_name = 'transaction'
        verbose_name_plural = 'transactions'
How to add data
In Django admin, you can import data for the Transaction sections.
To do this just click on IMPORT button in each section, then select your csv, xls or etc file and submit it.
Download Transactions Sample data
Files (that implements the feature)
- In this section, create a view in view.py to implement CRUD (
Create,Read,Update,Delete):
from django.views import View

class TransactionView(View):
    def get(self, request):
        pass

    def post(self, request):
        pass

    def put(self, request):
        pass

    def delete(self, request):
        pass
We use
getto display items and forms,postto store a new item,putto update an item, anddeleteto remove an item.
- jQuery (AJAX) has been used to make changes in the datatable. Which is located in the app_js.js.
Requirements
There is a convenient package to an integrated set of Django applications addressing authentication, registration, account management as well as 3rd party (social) account authentication that is very easy to use.
The package is django-allauth and you can read its doc to use it. and also recommend a youtube video for easier implementation.
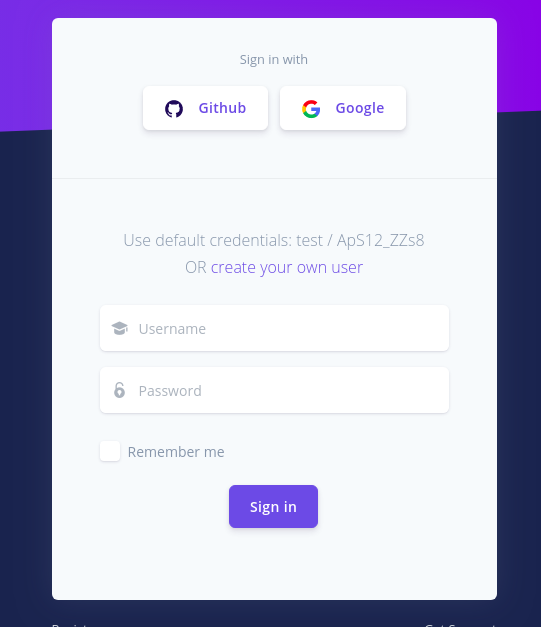
Files (that implements the feature)
In this section, we selected Google and Github to implement.
- Added buttons in login.html and register.html.
- REST APIs test:
$ python manage.py test app.tests.RESTAPIsTest- GraphQL test:
$ python manage.py test app.tests.GraphQLAPIsTestThis section will point users to https://docs.appseed.us (WIP)
Django Seed Project - Provided by AppSeed App Generator.