My master's thesis involves using machine learning to predict traffic patterns in bikeshare systems across the globe. As part of that work, I have a dataset for the bikeshare system in Oslo (currently operated by ClearChannel), along with datasets for London, New York, Washington D.C. and Chicago, IL.
This app shows a visual representation of the dataset mentioned above.
- Compile the application and launch it.
- Uncompress the zip files in the
example-datafolder. - In the app, browse to one of the sub-folders under the
example-datafolder. - Click "Ok" and wait for the dataset to be loaded.
- Click play (or press the spacebar) and enjoy the animation!
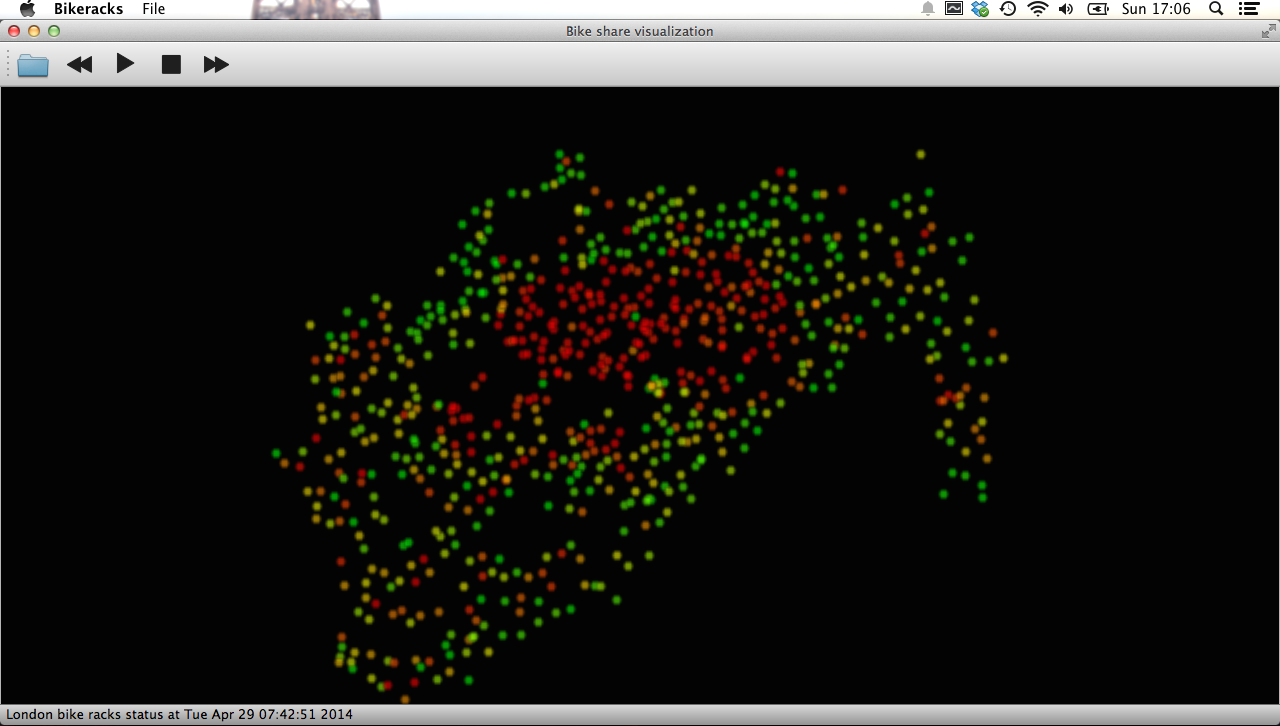
Figure: Pre morning rush visualization of London bike racks
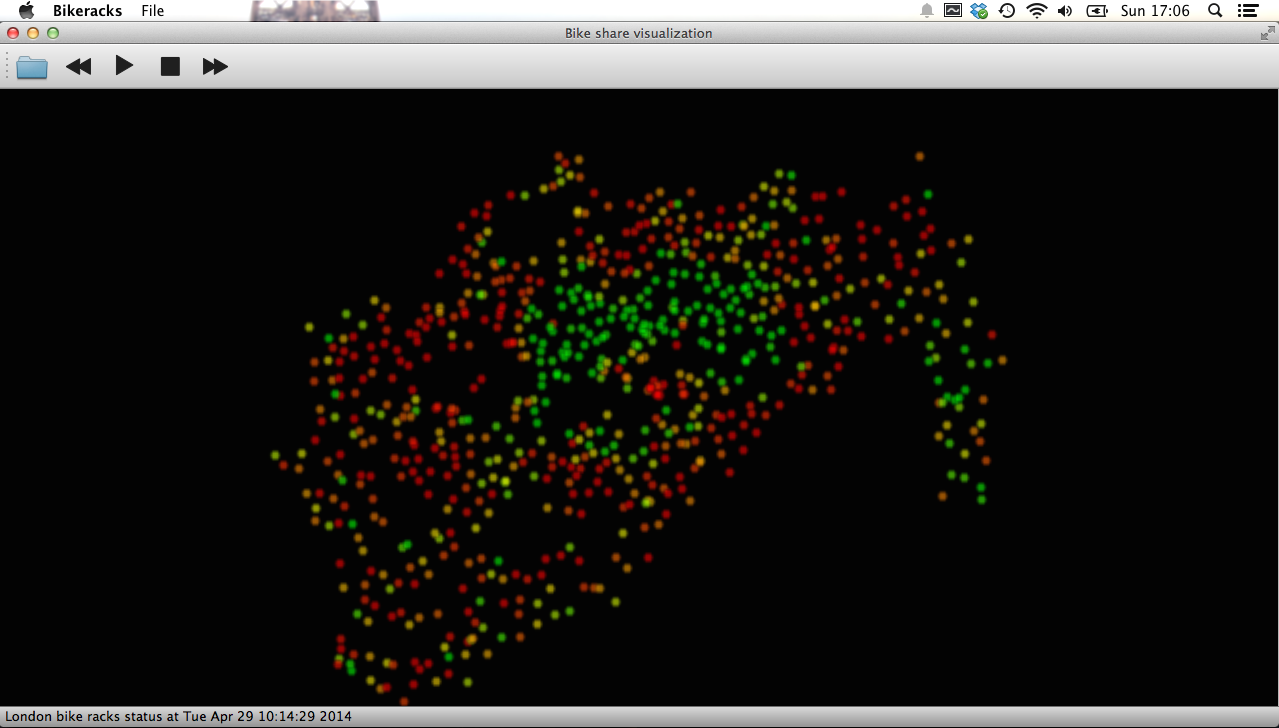
Figure: Post morning rush visualization of London bike racks
- Based on Qt by Digia
- Data collection for Oslo done by Martin Stensgård @mastensg
- Thanks to the PyBikes project, which helped me gather data for a number of bikeshare systems around the world.
- Developed by @arnabkd
- The project homepage can be found [here!] (http://arnabkd.github.io/bikes-timeline-qt)