
Currently Rental bikes are introduced in many urban cities for the enhancement of mobility comfort. It is important to make the rental bike available and accessible to the public at the right time as it lessens the waiting time. Eventually, providing the city with a stable supply of rental bikes becomes a major concern. The crucial part is the prediction of bike count required at each hour for the stable supply of rental bikes.
The dataset contains weather information (Temperature, Humidity, Windspeed, Visibility, Dewpoint, Solar radiation, Snowfall, Rainfall), the number of bikes rented per hour and date information. Attribute Information:
- Date : year-month-day
- Rented Bike count - Count of bikes rented at each hour
- Hour - Hour of he day
- Temperature-Temperature in Celsius
- Humidity - %
- Windspeed - m/s
- Visibility - 10m
- Dew point temperature - Celsius
- Solar radiation - MJ/m2
- Rainfall - mm
- Snowfall - cm
- Seasons - Winter, Spring, Summer, Autumn
- Holiday - Holiday/No holiday
- Functional Day - NoFunc(Non Functional Hours), Fun(Functional hours)
Users can verify their trip details (distance, duration) and measure of bodily activities (burnt calories). With this kind of smart technology and convenience, the use of Rental bikes is increasing every day. So, there is a need to manage the bike rental demand and manage the continuous and convenient service for the users. This study proposes a machine learning based approach including weather data to predict whole city public bike demand. A ML model is used to predict the number of rental bikes needed at each hour. Bike Demand has to be modelled with the available independent variables. It will be used by the management to understand how exactly the demands vary with different features. They can accordingly manipulate the business strategy to meet the demand levels and meet the customer's expectations. Further, the model will be a good way for management to understand the demand dynamics of a new market.
- Reading and Understanding Data
- Visualising the Data
- Data Preparation
- Splitting the Data into Training and Testing Sets
- Feature Scaling on the train data
- Building the Model
- Residual Analysis of the train data
- Making predictions using final model
- Model Evaluation
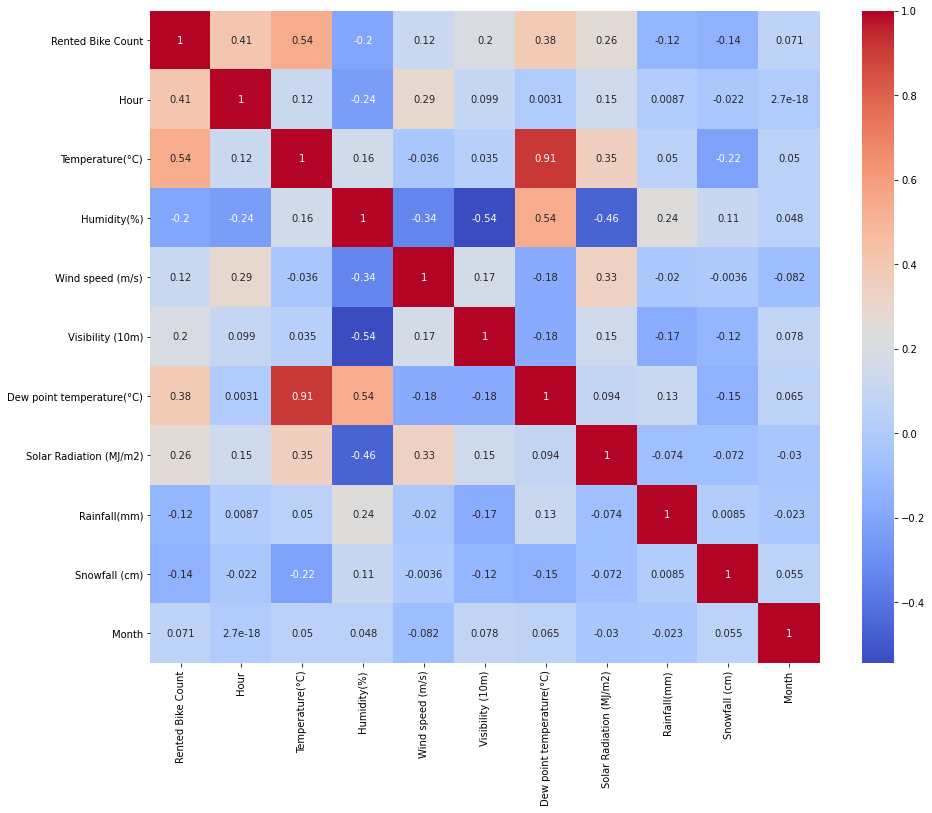
- It is clear from the heatmap, the variables Hour, Temperature, and Dew point temperature have a high impact on the target variable.
- As we can see that the independent variable Temperature and Dew point temperatures are highly correlated.
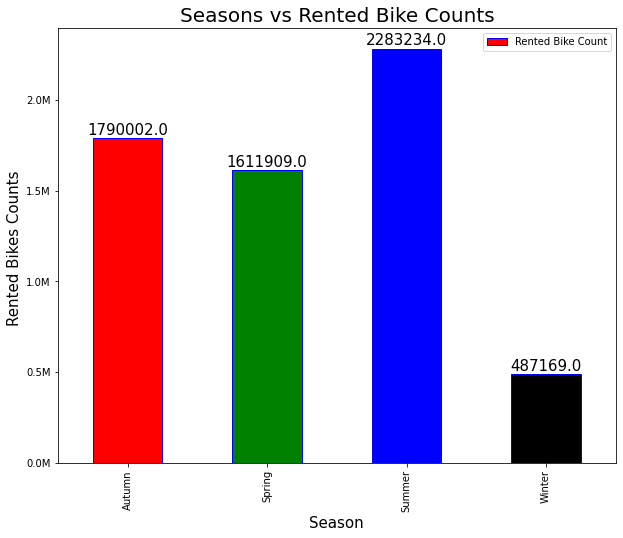
- From the chart, we can see that the highest number of bikes are rented in the summer season.
- In the winter season, people prefer fewer bikes as compared to other seasons

- Very few bikes are hired on the holidays.
- The majority of the bikes are rented on days other than holidays.

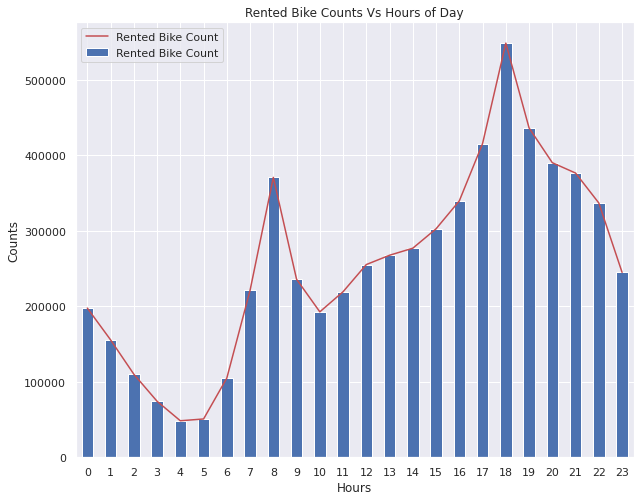
- The usage of rented bikes is high in between 4 pm to 10 pm. It means people take bikes on rent while returning to their homes from their workplaces to avoid heavy traffic.
- At 8 am in the morning the usage of rented bikes is higher than normal. It means people take bikes on rent to go to their workplace or dropping their children at school.

-
The temperature, hours, and solar radiation features were found to be more relevant for the bike count required at each hour for the stable supply of rental bikes.
-
As we have analyzed the various features, we have seen that people prefer to take bikes on rent when temperature is near about 25 degrees Celcius.
-
Other factors such as rainfall and snowfall also have an impact on the requirement of bikes for rent. Because in heavy rainfall and snowfall bike riding sometime becomes dangerous.
-
As we have analyzed that the rental bike demands are high in the evening and in the morning. So bikes should be available at that time to fulfill the bike demands.
-
The Bike demand increases with an increase in visibility and decreases with an increase with humidity.
-
We tried adding possible columns to make the model a bit more complex but for Linear Regression model it is still too general.
-
We have to make our model more complex for better discretion or move to tree and ensembling algorithm for better results.
Random forest gives predictions better than a decision tree model. Predictions made by Gradient Boosting are better than all the models that we have used. The value of the Adjusted R-squared for the Gradient Boosting method is 0.875, which is very good.
Adjusted R-squared for both Gradient Boosting and CatBoost are almost same. The adjusted R_squared score for CatBoost is 0.883. Because of the additional benefits, I will choose CatBoost over Gradient Boosting.