This is a simple python package for statistical distributions. Currently this package calcuates Binomial and Gaussian distribution.


pip install minimal-statsWe can directly provide the mean and standard deviation of data (or read data from a file) and add two gaussain distribution.
    >>> from distributions import Gaussian
    >>> g1 = Gaussian(180, 34)
    >>> g1
    g = Gaussian(mean=180, stdev=34)

    >> str(g1)
    'mean 180, standard deviation 34'

    >>> g2 = Gaussian(180, 34)
    >>> g1 + g2
    g = Gaussian(mean=360, stdev=48.08326112068523)
Here, we read data from a file, calculate mean, standard deviation and probability density function of gaussian distribution and then see graphical output
    >>> from distributions import Gaussian
    >>> g = Gaussian()
    >>> g.read_data_file(r'\tests\input\numbers.txt')

    >>> g.calculate_mean()
    78.0909090909091
    >>> g.calculate_stdev()
    92.87459776004906
    >>> g.pdf(5)
    0.0031515485379333356
    >>> g.plot_histogram_pdf()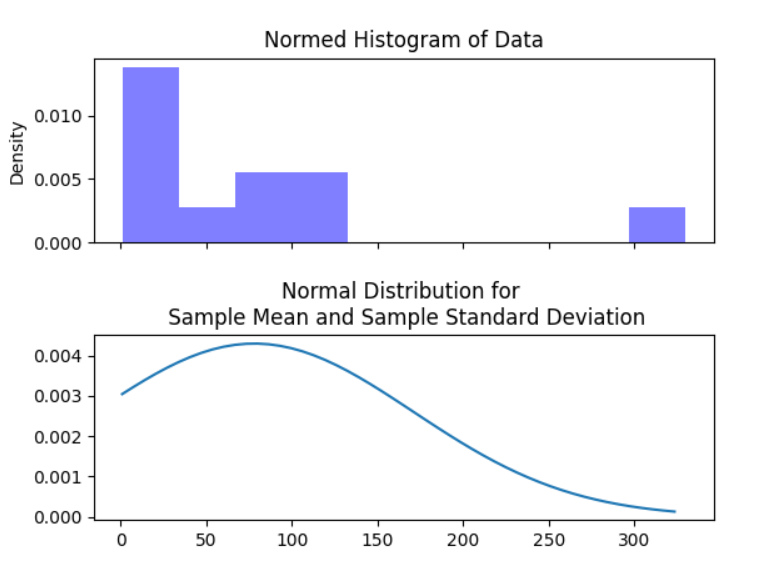
We can directly provide the n and p of data (or read from file as before) and calculate mean, standard deviation and probability mass function of binomial distribution.
    >>> from distributions import Binomial
    >>> b = Binomial(0.15, 60)
    >>> b
    b = Binomial(p=0.15, n=60)

    >>> b.calculate_mean()
    9.0
    >>> b.calculate_stdev()
    2.765863337187866
    >>> b.pmf(7)
    0.11985659270959788

    >>> a = Binomial(0.15, 50)
    >>> a + b
    b = Binomial(p=0.15, n=110)
Here, we read data from a file, `b.replace_stats_with_data()calculate mean, standard deviation, n and p of Binomial distribution and then we plot bar graph of pmf.
    >>> from distributions import Binomial
    >>> b.read_data_file(r'\tests\input\numbers_binomial.txt')
    >>> b.replace_stats_with_data()
    >>> str(b)
    'mean 8.0, standard deviation 1.7541160386140584, p 0.6153846153846154, n 13'
    >>> b.plot_bar_pmf()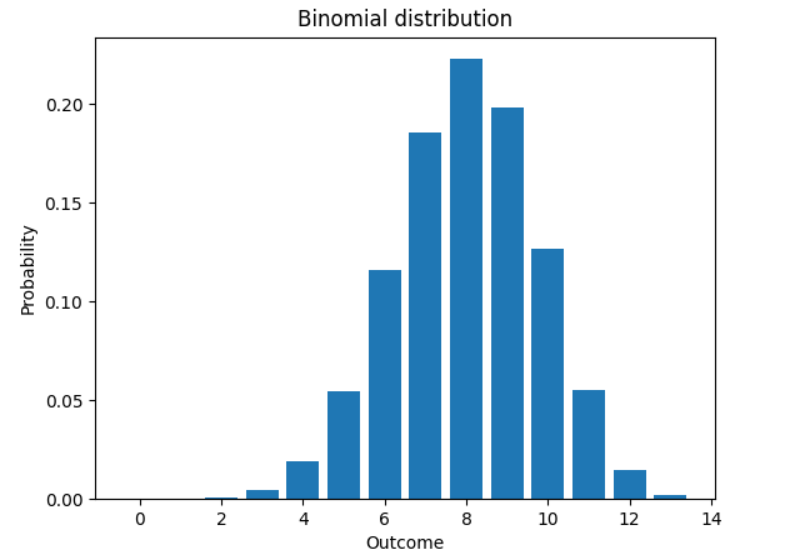
We appreciate feedback and contribution to this repo! Before you get started, please see the following:
This project is licensed under the MIT License - see the LICENSE file for details