We developed XGB5hmC, a high-performance identifier of RNA 5hmC. We use extreme gradient boosting (XGB) as the best model. In addition, we investigated other models, such as random forest, ada boosting, and gradient boosting. First, IlearnPlus was used to run 15 different machine-learning models using 35 different descriptors to select the best descriptors. Then, it was decided that the composition of k-spaced nucleic acid pairs (CKSNAP), pseudo-K-tuple nucleotide composition (PseKNC), and position-specific trinucleotide propensity single strand (PSTNPss) are the best descriptors. Subsequently, the features were combined and reduced in dimension using chi-squared test filtering.

The first files in the code0 folder consists of as follows:
- benchmark dataset (this contain dataset used in the experiment)
- the code for finding the best feature
- the performance result generated from IlearnPlus Inside the Find_Best_Feature folder, there are two '.ipynb' files. Here are the procedures for getting the best feature
- Run the featureRNA_2.ipynb to convert data RNA sequence into standard data RNA sequence that can be understood by IlearnPlus
- Separate the training data sequence and testing data sequence by 0.1
- Use only the training data in Ilearnplus
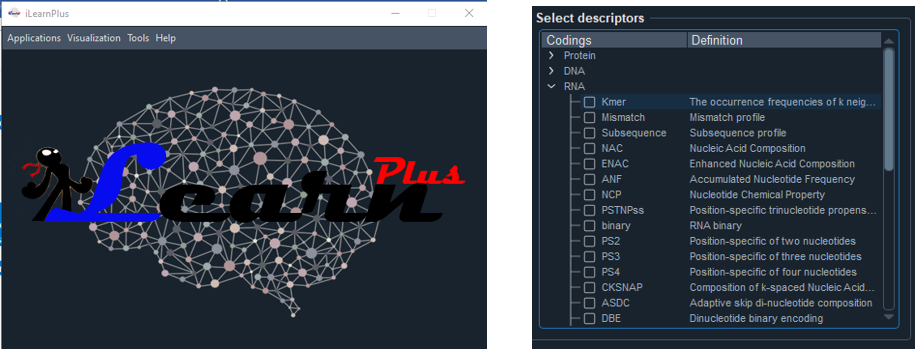
- Run the ilearnplus software and choose the feature extraction method for the RNA sequence
- In the menu bar choose an application and choose Ilearnplus estimation
- Check all the boxes in the menu of select descriptors method like this figure
- Choose one of the machine learning methods you want to run, then start and save the result as a .tsv file

The results are saved and can be seen in folder performance_result_from_Ilearn_plus
After running the Ilearnplus and saving all performance results, now we want to select the best descriptors by using the second code in this folder. Run file find_bestfeature.ipynb. This code will generate the top 3 descriptors. The 3 best descriptors were saved in folder best_descriptor
The second file in the code2 folder consists of as follows:
After getting the best descriptor, now we are ready to run the model. There are two experiments. The code is divided into several modules. Every module should be called in the main code. The main codes are:
- experiment1_10fold_benchmark.ipynb and
- experiment2_10fold_benchmark.ipynb
The modules are:
- Best_featureRNA.ipynb
It is used for generating an object dataset. By using this object, the dataset can be shuffled and separated between training and testing by a ratio of 0.9 and 0.1, respectively. The number of folds also can be set using this module. We set nCV = 10 -Data_Conversion_1
Many functions in this module are used for collecting the dataset so that it can be more compact. We want to join the input and label in data training and data testing.
- ML_Module_v1
We create many machine-learning models here. Setting parameters should be done in this module. The main code just selects the type of machine learning method that wants to be executed
- Performance_Module_1
After running the machine learning using the compact dataset, we get the performance results. which are calculated in this module. The trained model is also saved using this module.
- Data_Visualization_1
This module focuses on visualizing the performance result. The function for creating the tables and bar graphs is included here.
The first experiment processes the given input and feeds this into the model. The input only uses the best descriptor which resulted from the previous process. The dataset will be separated into 3 types of data: training, validation, and testing. The training and validation ratio is 0.9 and the rest is 0.1 used for testing. The location or region of validation data is determined by applying 10 cross-fold validation.
The second experiment processes the given input using the best 3 descriptors. This one is more important than the second experiment. What are being done in this experiment are as follows:
- to combine the descriptor to be 4 fusion descriptor
- to make a normalization for the feature in the fusion descriptor using the min-max scaler, this is only for finding the most important feature using the chi-squared test purpose.
- The chi-squared test is used to get the most important features in the fusion descriptor. This process also will eliminate the unimportant features. The number of features will be reduced.
- The output of the chi-squared test is a p-value. Every single feature has its p-value. The higher p-value, the more important one feature is. We set the threshold value to cut off the feature that has a lower p-value than the threshold value.
- We try all of the threshold values from 0 and 0.95 to find the best performance
- We find that the location of shuffled data is also important to reach the best performance. Therefore, after finding the best performance we saved the shuffled dataset including data training and testing. Other variables like the p-value and the list of the bad feature are also saved in the folder P-value and list_bad_feature. All the models used in this experiment are saved in the folder saved_model
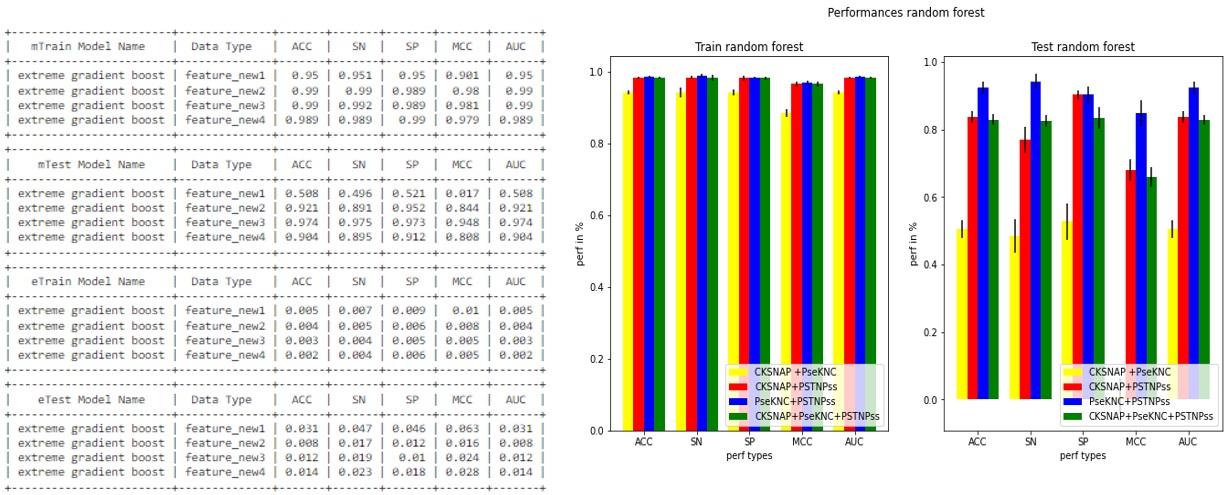
- Because of 10-fold cross-validation, then 10 models would be created which generate 10 performance results. To plot the performance, the average and the standard deviation of the performance results are calculated.
- This table is an example of the performance result generated by the model
The last folder (running_best_model) is only a little modification of the second experiment.
We add graphs like ROC and PR curves. We create this to make it easier and faster for the other user when trying our model. Additionally, we generate also the values of the importance of the feature in the reduced descriptor by model perspective. Run the last updated file running_best_model_2.ipynb

finding_threshold file in this folder is used to get the optimal value of threshold value in cutting off the features which have a lower p-value than the threshold value.