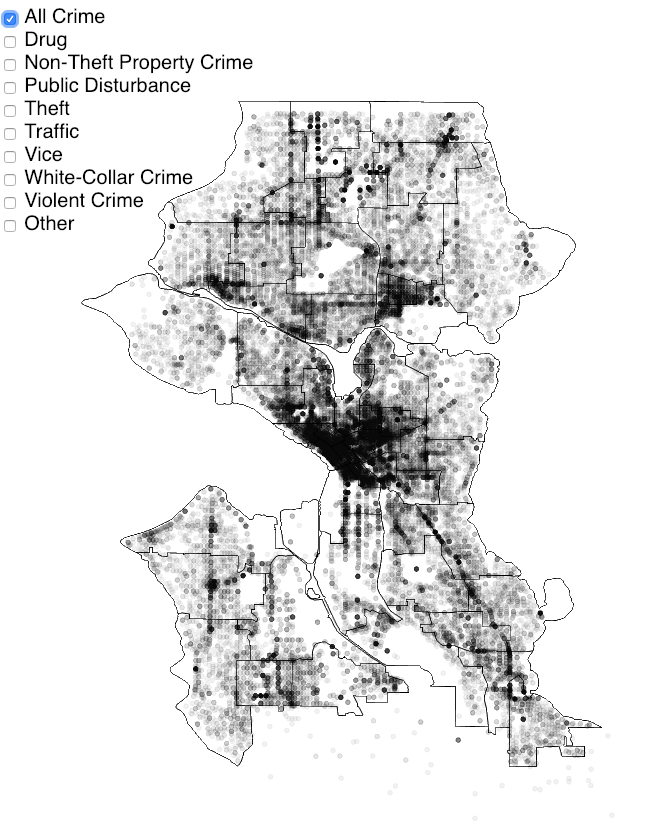
INFO 498E Data Science project analyzing and visualizing the crime rates within the Seattle area using D3.js (v3.4.6)
Created by Alex Gingras, Marie Clifford, and Augustus Yuan
Full disclosure, Alex Gringas did a majority of the coding and visualization for this work. While it might be hosted on my Github repository, I am looking forward to transferring the files over to him.
If you wish to see the visualization locally, you can clone this repository and open index.html. To avoid CORS origin policy, you can run the following command in terminal and launch Chrome
/Applications/Google\ Chrome.app/Contents/MacOS/Google\ Chrome --allow-file-access-from-files --allow-file-access --allow-cross-origin-auth-prompt
A huge thank you to johan/world.geo.json for providing us with the GeoJSON files for Washington!
Washington is divided up into a several counties, but it is also divided up by police beat zones known as precincts. Washington records how many crimes are called in and we are hoping to visualize this data with D3.
You can find a map of the precincts here.
You can also find the shape files we used here.