
Ushahidi viz for pirates to plot projects and milestones.
Check out the Pirate Plotr Render here. Video tutorial here pw: plotrpals.
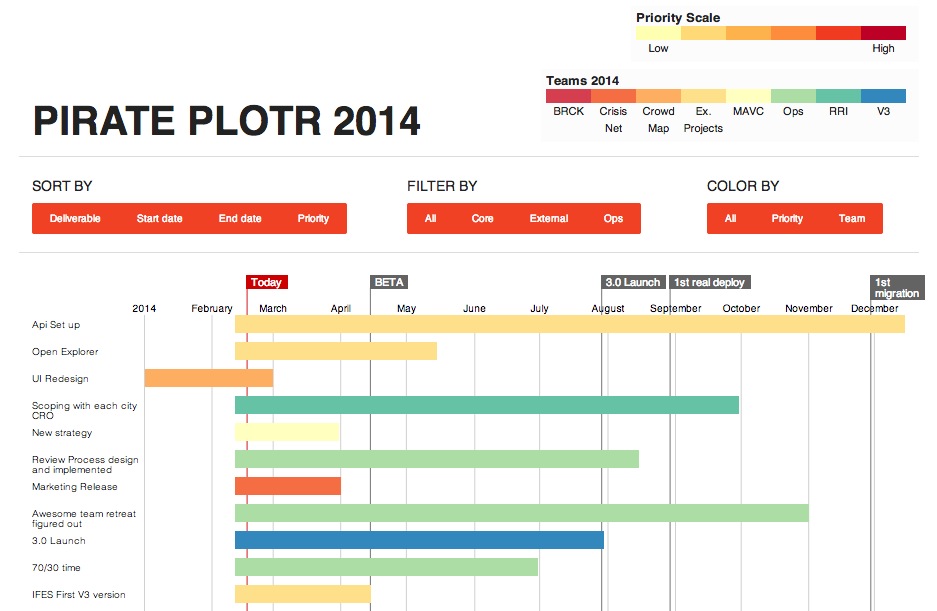
This is a simple sortable chart for viewing projects and tracking them on a timeline.
This is mostly for pirates @Ushahidi but also for everyone to have a global view of what's going on when and how the milestones/expectations/resourcing needs shake out.
Edit the csv in the /data folder to your desired plotting verbage.[1]- Edit data in the Google Spreadsheet here.
- Spreadsheet will update in the chart on a semi-frequent basis (depends on google, usually you can refresh the Pirate Plotr Render every 5 minutes and it will show your changes); all changes will be checked and QAuto-integrated for Monday morning calls.
- View and Sort the chart! Check the Pirate Plotr Render page.
Data csv looks like this:
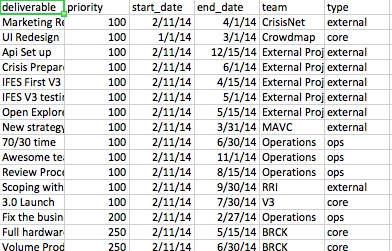
Headers are static, but all values are editable in the data.csv file.
| deliverable | priority | start_date | end_date | team | type |
|---|---|---|---|---|---|
| project1 | value1 | date1 | date2 | [V3/CrisisNet/...] | external |
| project2 | value2 | date1 | date2 | [V3/CrisisNet/...] | core |
- deliverable is project name
- priority is an arbitrary weight (price point? resources?)[2]
- dates are the start and end date of a project
- team is the name of the team responsible for the deliverable
- type is one of 4 categories for filtering purposes (core, external, ops, milestone)[3]
This is spreadsheet-powered because that's a maintainable format for all contributors; easily editable/updatable.
Yays thanks for reading! Shoot me questions if you have any: auremoser@gmail.com.
[1]: Previously, I manually updated the /data/data.csv file and then populated that data in the chart. Now the chart is GDoc powered, to enable easier editing for all pirates in the party. :)
[2]: We can decide what numerical value to prioritize by, I just wanted to log this as a sortable placeholder for future values we might want to track.
[3]: Milestones are vertical plum lines on the chart. You can draw a plum line, as opposed to a bar, by entering a deliverable name, start_date and type of project as "milestone"). Check the csv for examples of this.