Application for no-code data preprocessing using R Shiny.
An attempt at creating an easy-to-use, no-code application for data preprocessing for machine learning.
Try it at: https://austinlim.shinyapps.io/Preprocessing_App/
As mentioned in the project, Data Science and Analysis Application, a compliemntary project on a no-code solution for data preprocessing, similar to how Paxata is to DataRobot, was created around the same time. However, my initial approach was not working out and I put it on hold for about 10 months. During the break before starting work, I restarted the project with a slightly different approach and this worked out much better and allowed me to make significant progress on this project.
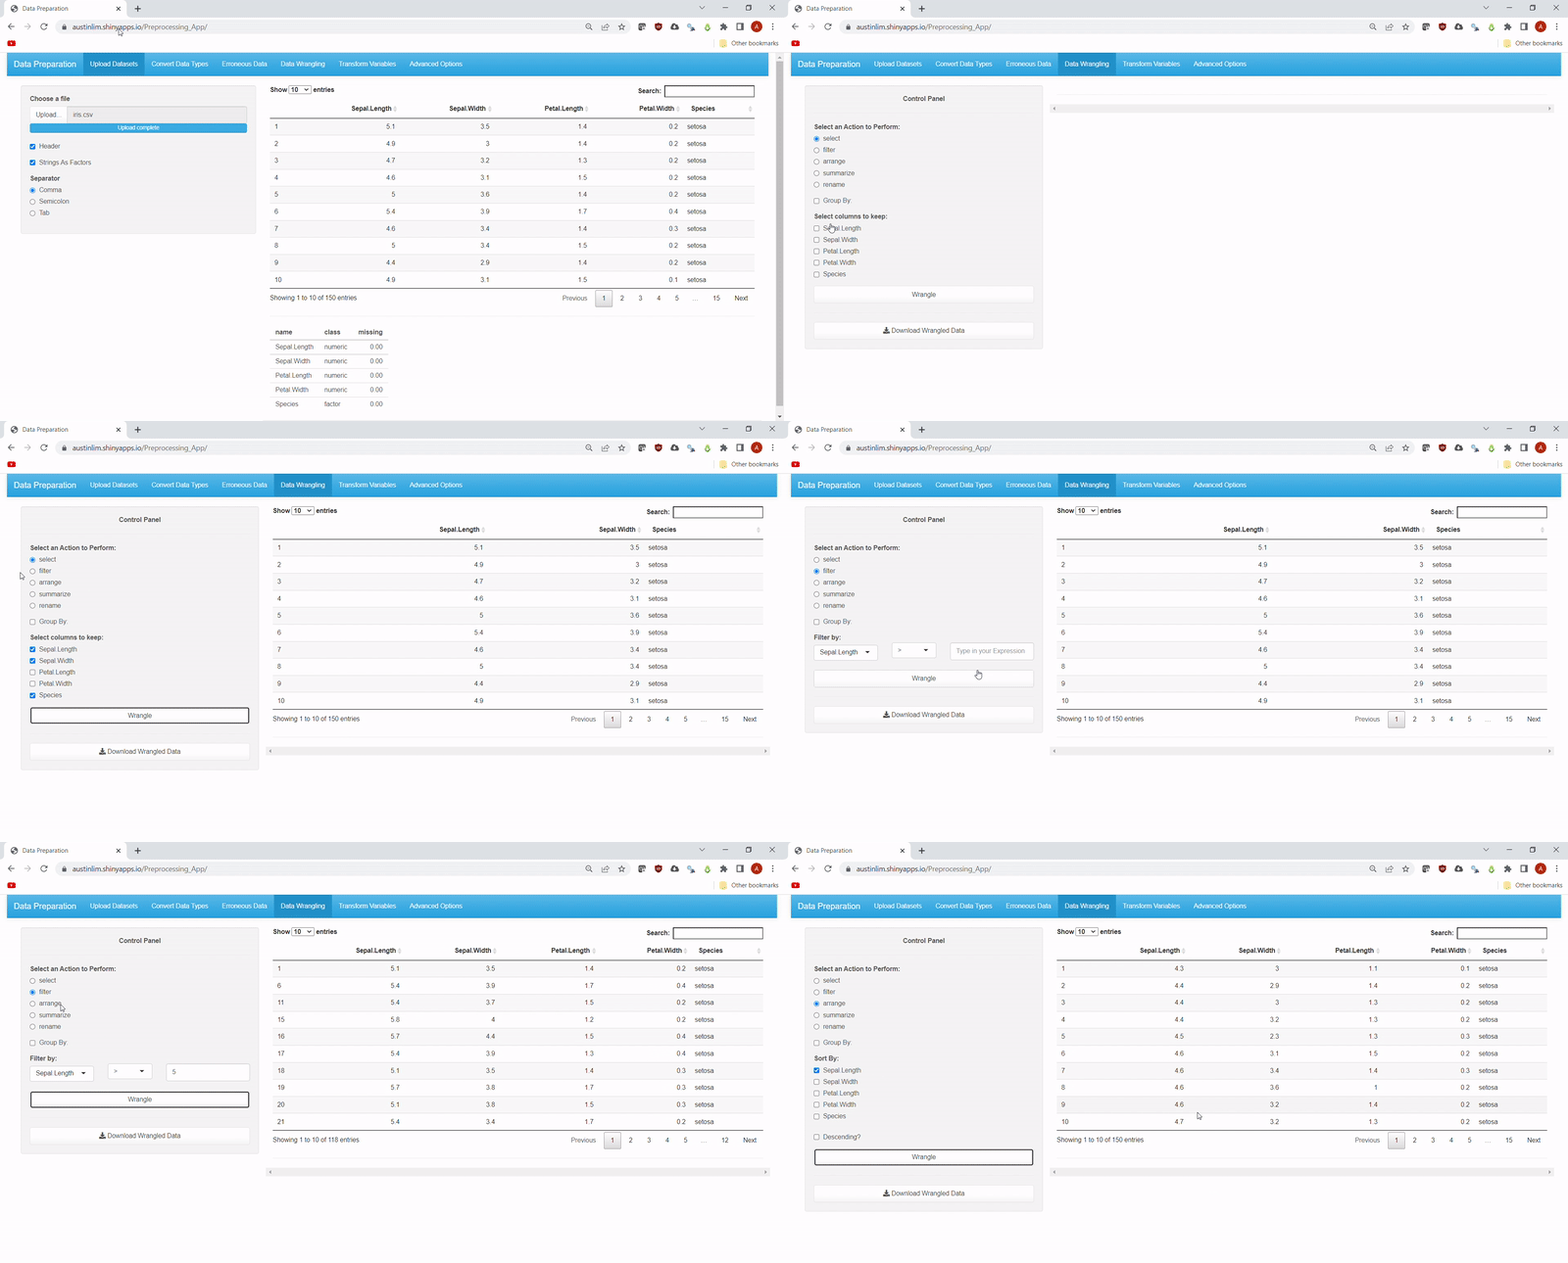
Users can upload their own .csv files with the options to choose a separator, use the first row as headings or convert strings into factors. The uploaded data can be viewed as an interactive data table using DT library and a quick summary of the data is also found at the bottom. See Feature 1.
Datasets may contain numbers that represent factors and strings that represent Datetimes, hence this feature allows users to easily convert between data types using the console. Currently supports conversions to numeric,factor and date data types. The example file below is the famous mtcars dataset in R.
By specifying a datetime format, we can also convert strings to datetime. The example below uses a snippet of data for the top_songs_app project which contains a Date and a Published column that are datetime in nature.
Datasets may contain duplicated data or missing values. Hence, this feature allows users to identify these rows and either drop or impute them in the case of missing values.
For missing values, we can also remove them, in this example, I used the famous iris dataset where I introduced NAs using the prodNA of missingForest library.
Alternatively, we can replace the NAs using the mean or other values with the simple imputation function. Currently, this feature supports mean, median, backfill, frontfill and random methods for numeric data, and Mode, backfill, frontfill and new cateogry methods (treat NAs as a new category) for factor data.
Sometimes, we may need a subset of the data or simply reorder/rename data. Other times, we may need a snapshot summary of the data, we have. Hence, this feature allows users to make use of all the common dplyr functions: select, filter, rename, arrange and summarize. Under filter, data can be subsetted by: ==, >, >=, <, <=, !=, %in% and contains
A list of summary functions includes: mean, median, max, min, sum,sd,IQR and count.
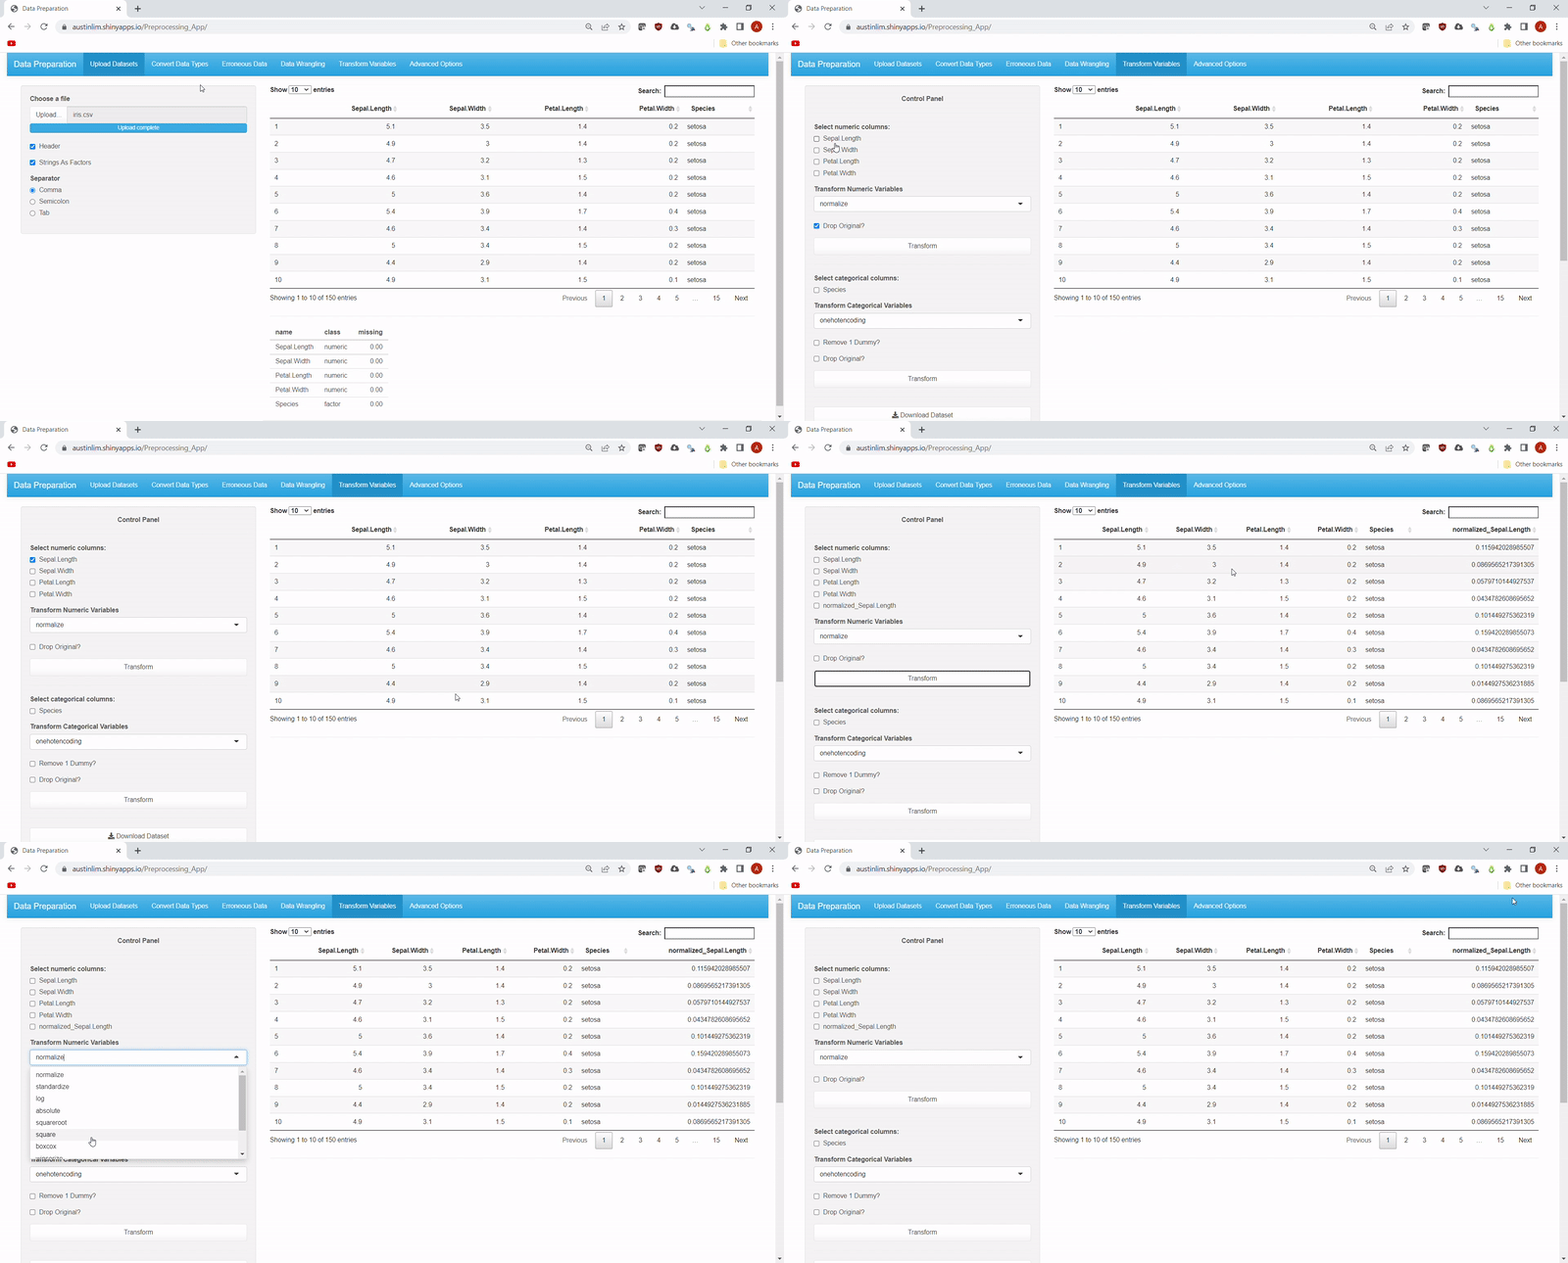
"T" in "ETL" stands for Transform and variables in datasets may need to be transformed to create new variables. Hence, common transformations for numeric data and factor data have been included. Methods to transform numeric data inlcude: log, abs,Winsorize, rank, sqrt, square, normalize, standardize, binning, and boxcox transformations.
While methods to transform factor data currently includes: onehotencoding and relevelling.
To leverage on the abundence of resources and packages developed for smart imputation of missing values, this feature allows the user to use packages such as mice, Amelia and missForest. However, currently the application only uses the default settings of the respective functions. More customizability to be added as an upgrade in future.
Dimensionality reduction may be necessary for datasets with too many variables that may be highly correlated, leading to multicollinearity issues amongst many other problems, hence this feature allows users to use 4 different methods: lda, ica, t-SNE and pca. Note that the t-SNE method only works for datasets with no duplicated data. The exmaple uses the iris dataset that has already removed the duplicated row.
Most machine learning problems will have a class imbalance issue which may affect results hence this feature allows users to use packages such as ROSE and smotefamily to deal with class imbalance by resampling the data. This example uses the famous nhanes dataset combined with a randomly generated ill column that is treated as the target variable. A plot showing the distribution of target variable helps to depict the effect of the resampling.
Another feature that may be necessary in data cleaning is joining datasets together from different .csv files. Hence, this feature allows the user to upload an additional dataset and select the keys from each dataset to join on. Joining methods include are: left, right, inner and cross. This example merges 2 sets of iris data on Sepal.Length.
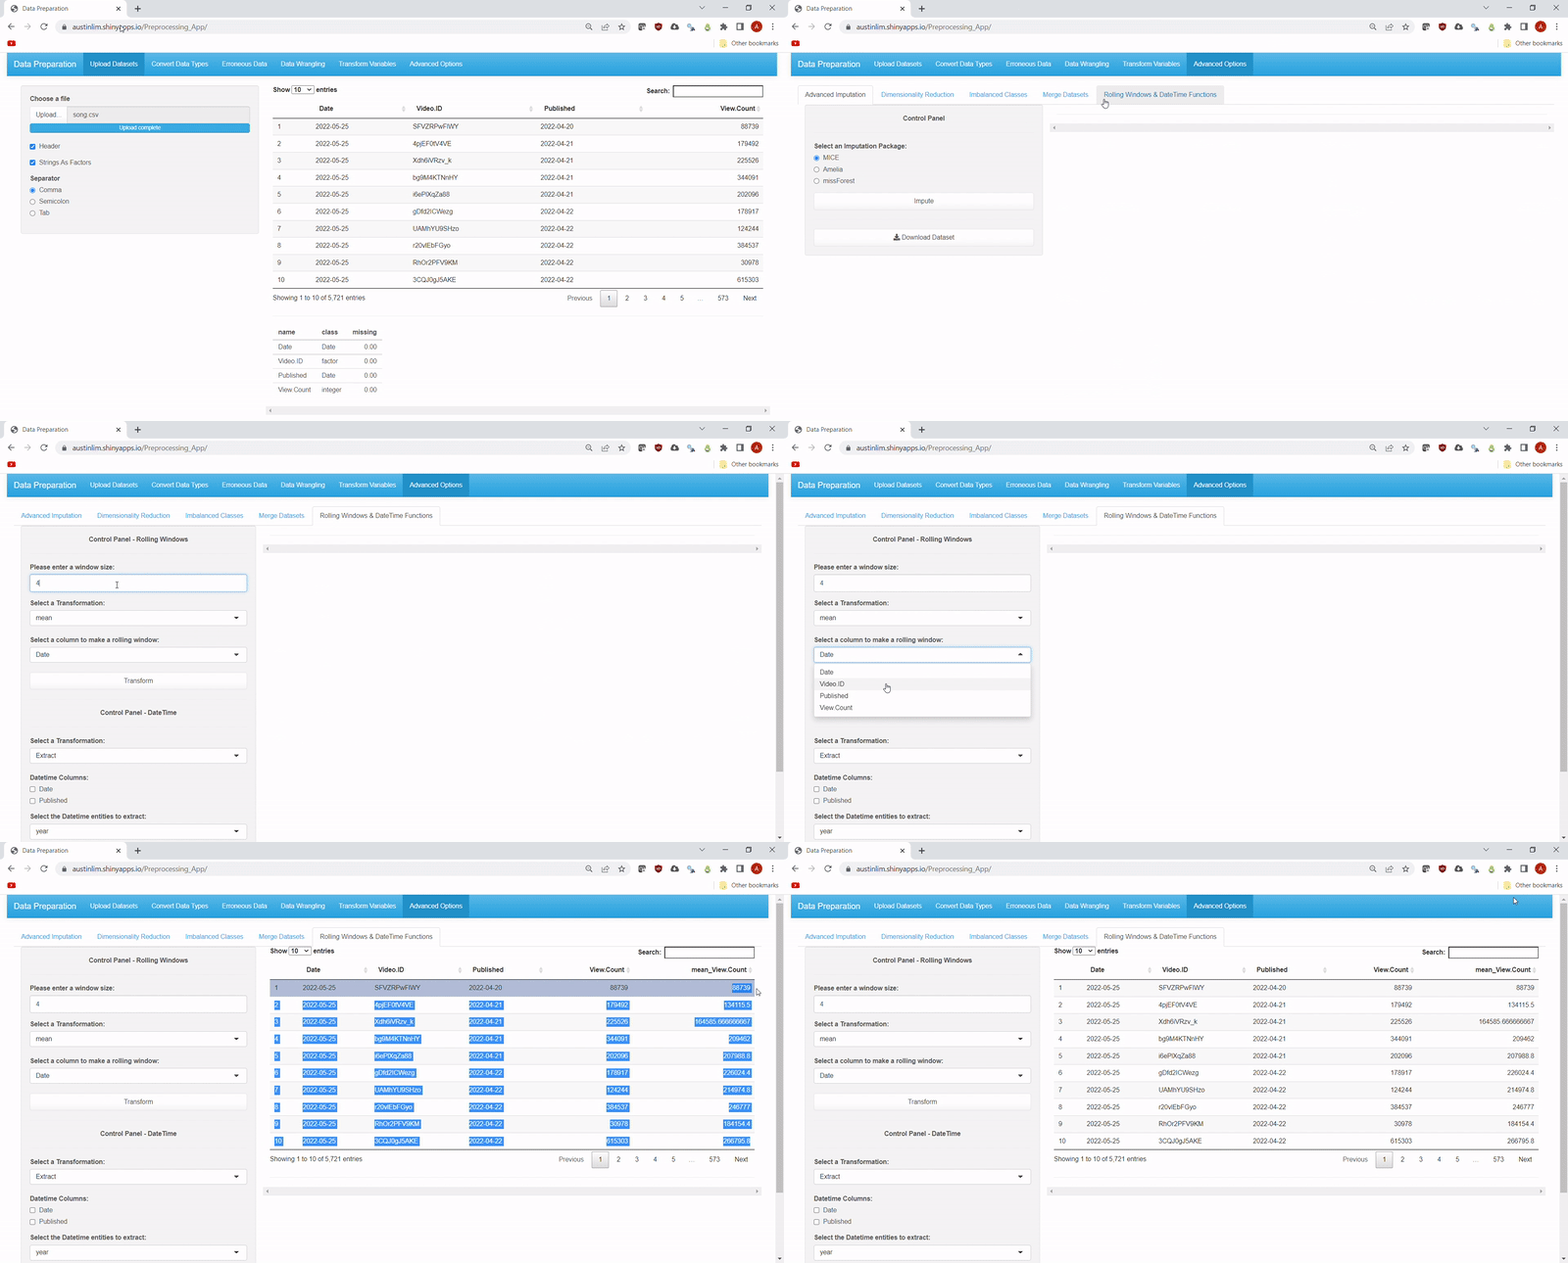
Lastly, time-related functions such as rolling window transformations and datetime functions have been included as additional options for data engineering. For rolling windows, the same list of aggregation functions as summarize in Feature #3 can be specified, along with the size of the window to roll on.
Meanwhile the datetime functions include: extracting other datetime elements from datetime variable(s) and calculating intervals of time.
The datetime elements that can be extracted include: year, semester, quarter, month, monthname (Spelt out as opposed to numbers), week, day, dayofweek (Spelt out as opposed to numbers), hour, minute and second. Units for interval calculations can also be specified, and the list is the same sans semester, quarter, monthname and dayofweek.
All pages except the first have a Download button to allow users to download the processed dataset that they are working on.
While working on this project, I realized a few things:
- Sometimes it is easier to take a break and resume work another day. There have been days where I would stare at the codes for hours on end without being able to fix a bug. Only for me to return to it the next day and realize that it was a silly little mistake like a missing/additional comma or a naming issue with my UI elements.
- There are multiple ways to get to the same outcome. For example, subsetting can either use
dplyr'sfilterorbaseR'ssubset. When encountering an issue with writing code 1 way, as long as time complexity isn't a huge issue, try another method. In fact, what allowed me to restart the project is trying out another approach as my original one was not behaving how I would like the data to behave. - On the second point, it can be detrimental to depend only on 1 way of doing things. There were many times as I was developing this project where I went: "I wished I could use Python" such as when implementing the
Imbalanced Classesresampling functionality as I had been more used to using Python'simblearnpackage for example. Personally, I feel that while the no-code is an ideal to strive for, it's still very much useful to learn widely and implement the best/easiest method for yourself.
Finally, as always, this project has several areas of improvement:
- The
Data Wranglingtab sees eachdplyrfunction working independently which means the user will have to repeatedly download and upload the temporary data. Apart from fixing this bug to make it so that all functions affect the temporary data cumulatively, it would be good for UX to allow multiple functions to be used at once due to the existence of%>%operators. However, I've not implemented this as the order in which the functions are used matters and so I held off. - It was quite late into development of the application where I realized how I could code to aviod multiple long
if-elsestatements which means that a cleanup of the code would make the code much more readable. - As mentioned, there are some functions that I could not fully flesh out such as the advanced imputation methods. Furthermore, I tested each feature independently which means that there could be cases where the application breaks when the method is not suitable for the data and it would be good to display a message to the user to notify them.
Again, there may be other bugs or areas for improvement or even features that I may not have considered. I would love to get into a discussion on what they are and how I can implement them.


