Welcome to the motifOverlapR wiki!
- Introduction
- What is motifOverlapR ?
- How to Use Motif OverlapR ?
- Data Sources
- Cite us
Transcription factors (TFs) are proteins that play pivotal roles in cellular development, differentiation and homeostasis by binding to specific genomic locations and regulating gene expression. Typically, to identify Transcription Factor Binding Sites (TFBS) one would conduct chromatin immunoprecipitation followed by sequencing (ChIP-seq) which can be used in conjunction with transcriptomic analysis of gene expression to identify genes regulated by the transcription factor. However, this approach is not feasible for all TF's because many TFs lack a sufficiently high-quality antibody that can detect endogenous expression. Consequently, there is a need for computational identification of TFBS that can be used in conjunction with the transcriptomic data to identify TFBS and therefore genes regulated by specific TFs in specific cell types. Here we present, motifOverlapR, a bioinformatics tool that can predict TFBS through the integration of multiple genomic and epigenomic data types.
motifOverlapR is a computational bioinformatics tool which predicts TFBS by integration of genomic, epigenomic and transcriptomic data. motifOverlapR firstly identifies all DNA sequences that match the Position Weight Matrix (PWM) of the TF of interest, therefore identifying all possible motifs. Next, motifOverlapR identifies which of these motifs fall in regions of the genome that are found to play integral roles in gene regulation, such as promoter regions or enhancer regions. A consequence of many motifs that play important roles in gene regulation are frequently conserved, motifOverlapR can also identify motifs in promoter sequences that fall into conserved regions (regions with a PhyloP score >0). Typically, enhancers evolve rapidly hence; the TFBS located in them are subject to higher turnover rates hence this conserved option is only available for promoter regions. To identify which sites are accessible to the TF of interest, motifOverlapR will identify which of the regulatory motif instances are located in active chromatin states in the cell type in which the TF is expressed. These sites are considered the unbiased predicted TFBS as they integrate genome-wide data. An additional feature of motifOverlapR is to integrate transcriptomic data by uploading a list of genes that showed differential expression in the absence or mutation of the TF. motifOverlapR will return predicted TFBS that would regulate these genes expression.
motifOverlapR contains 3 tabs as illustrated in the figure below
- The computational Pipeline
- The genome browser and motif Table
- Gene Ontology
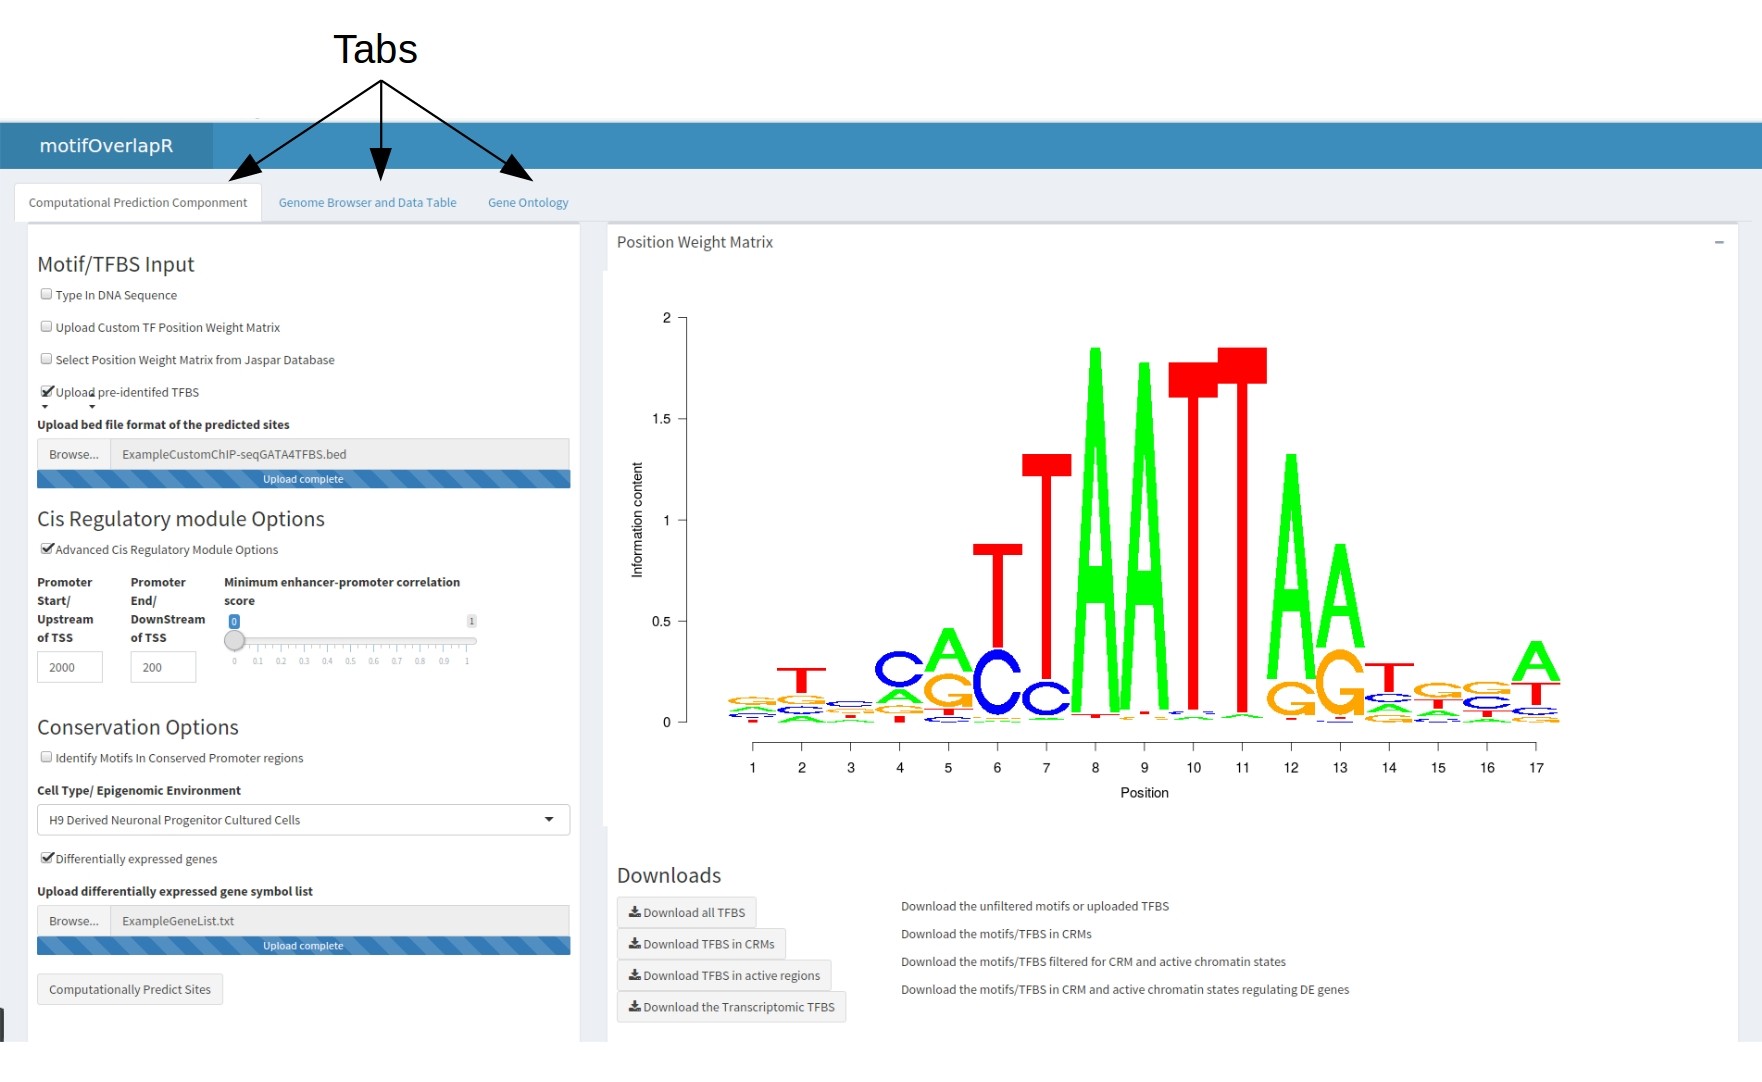
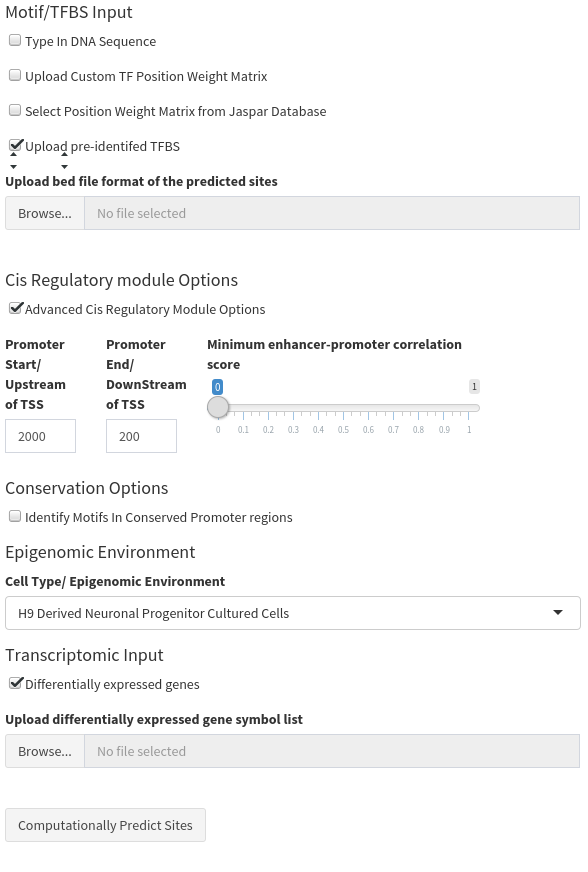
In the first table contains the motifOverlapR input, multiple download steps and the final highly-comprehensive table. There are 5 total inputs: Input 1: Motif and TFBS Inputs the Position Weight Matrix to match to the genome. There are 3 separate options for this.
- Type in the DNA sequence (No spaces)
- Upload a custom position weight matrix in the JASPAR format (including the header) in a csv format
- Select an existing PWM matrix from the JASPAR database
- Upload Pre-identified TFBS in the UCSC bed file format without any headers. Please see here for more information on UCSC file structure
With all PWM inputs there will be the option of how accurate you want the DNA sequence to match the PWM. This a percentage where 100% is DNA-sequences that give a perfect score at every position of PWM, 50% returns DNA-sequences that score at least 50% of the maximum score. We would recommend examining your PWM and determining how stringently you would want.
Input 2: Advanced Cis Regulatory Module (Optional) Adjust the length of promoters. By default this is 2000bp upstream of the TSS and 200bp downstream however, this is adjustable.
Another adjustable paramter here is the minimum correlation between an enhancer region and TSS. This will adjust how correlated the expression of the enhancer and the TSS are, the greater the correlation the more likely the two are interacting. By default this slider is set to 0 to include all enhancer-TSS assoications.
Input 3: Conservation Data Identify motifs that are located in conserved promoter regions between vertebrate genomes. This is a checkbox that when selected will identify motifs that are in promoter regions that are falling into genomic regions that are completely conserved. Please be aware, this will download a 9GB file from UCSC that contains the PhyloP scores for the entire hg19 genome. Hence, this option may take hours to load the first time.
Input 4: Epigenomic Environment Select the cell type/Tissue type to predict the sites within This input will determine the epigenomic environment for each cell type hence allowing us to identify which motifs are located in active chromatin regions and therefore accessible to the TF. Typically, this will be the cell type in which the TF is expressed.
Input 5: Transcriptomic (Optional) Upload a list of genes that showed differential expression in the absence of the TF. This is an optional input whereby uploading a list of genes (in the gene symbol format ) will limit predicted TFBS to regulatory modules (i.e. promoters and enhancers) that regulate genes that showed differential expression.
The final output is a single table. Both tables contain the following information:
- Genomic coordinates of the TFBS
- All metadata uploaded with the TFBS in the raw data
- The CRM type it is located within
- The chromatin state the TFBS is located within
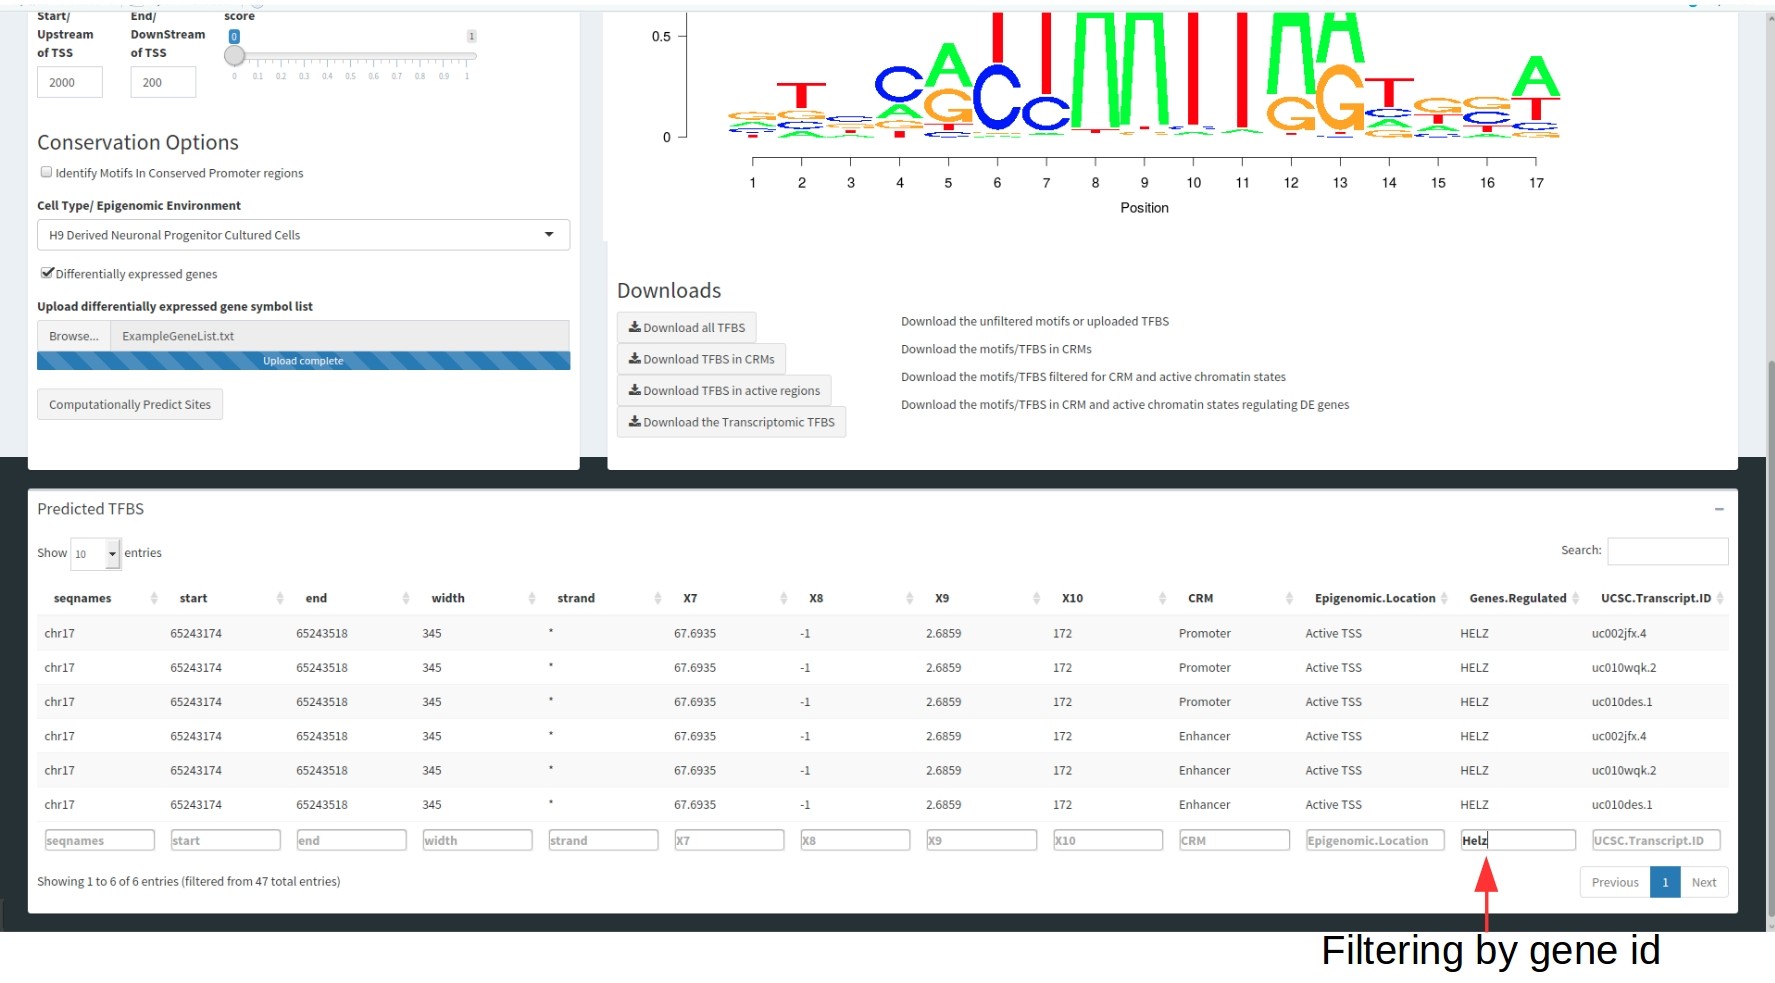
- The Gene regulated (as both a gene symbol and a UCSC transcript ID).
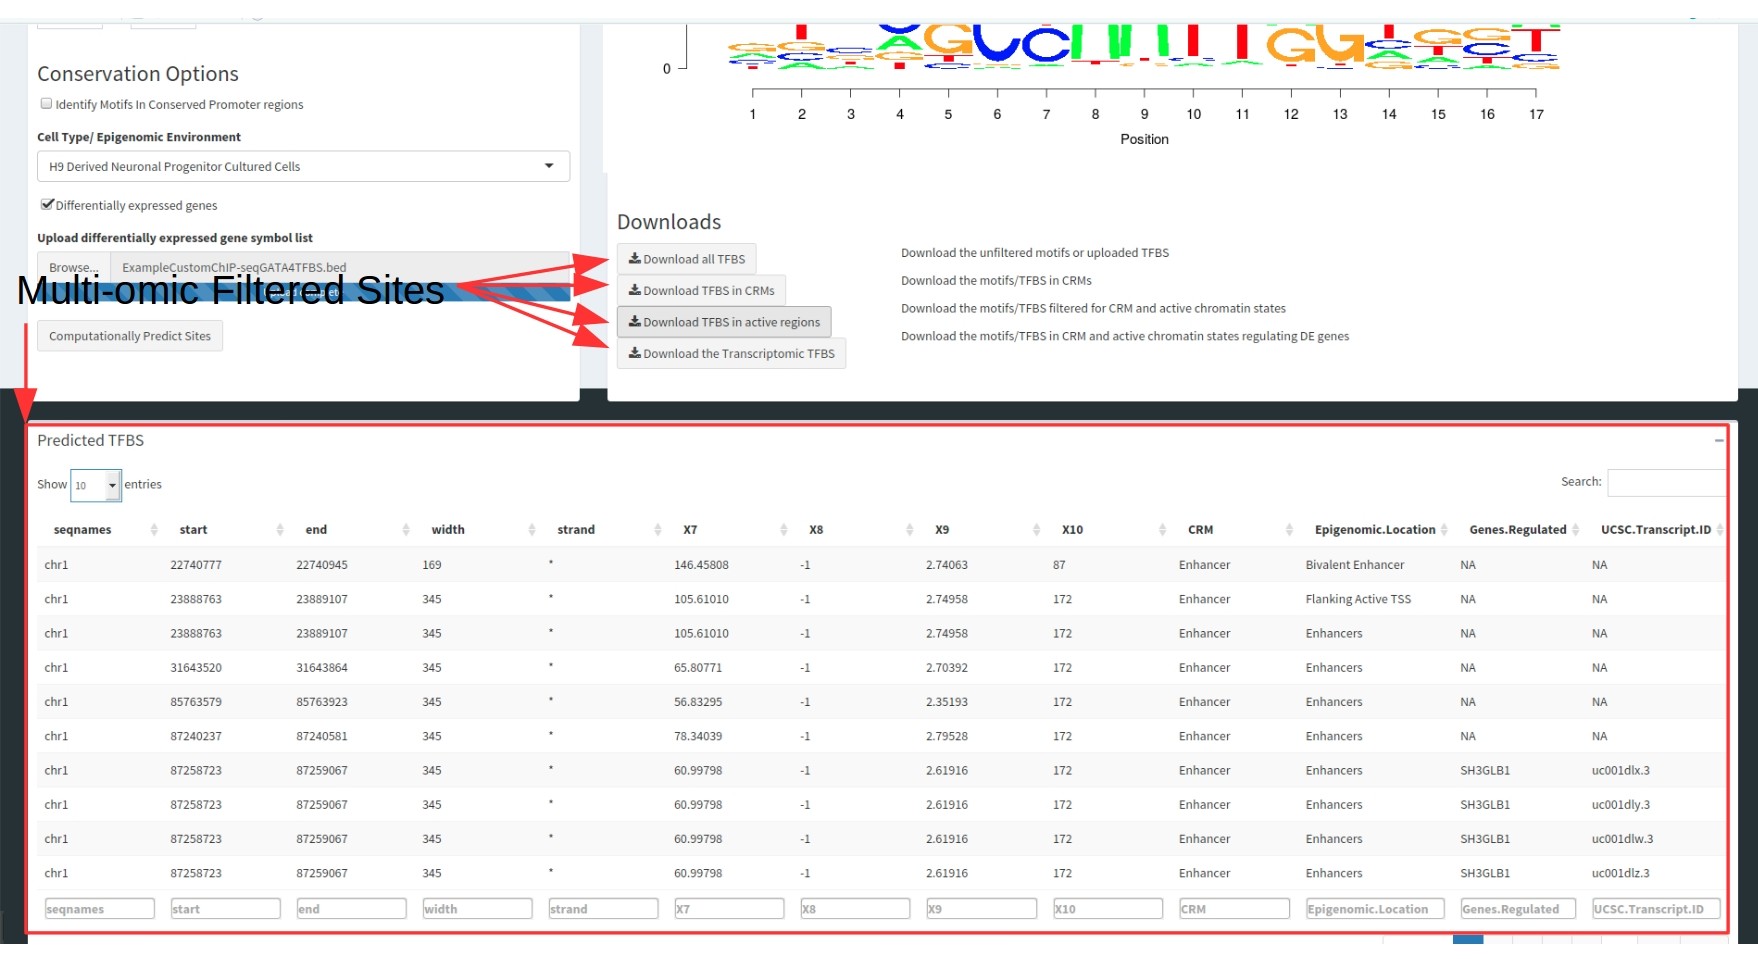
These tables are filterable by each of these columns to select for specific motifs.
MotifOverlapR contains an inbuilt genome browser that contains the results of the computational pipeline (therefore the two data tables) to interrogate the results further and more freely (containing a raw motif instance track as well).
The inputs for the genome browser are the genomic coordinates you wish to view and clicking go. Please be aware, this is computationally intensive hence requires a lot of ram. Thus, if you are running into issues, please try reducing the size of the region you're interrogating.
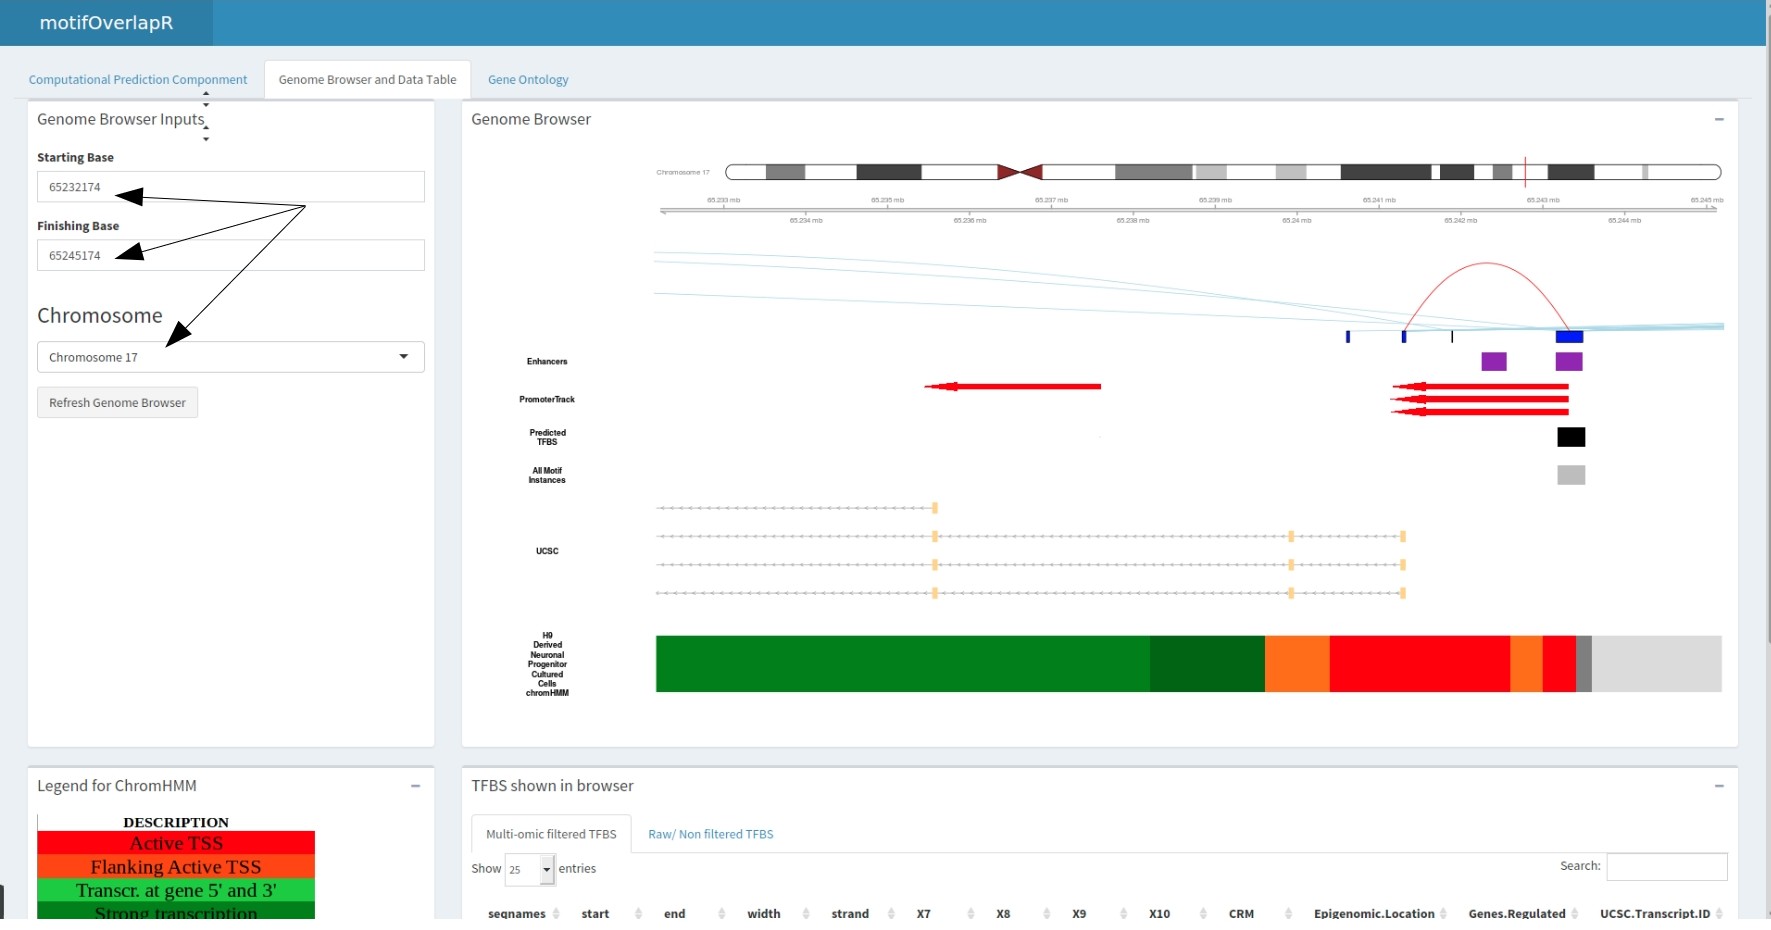
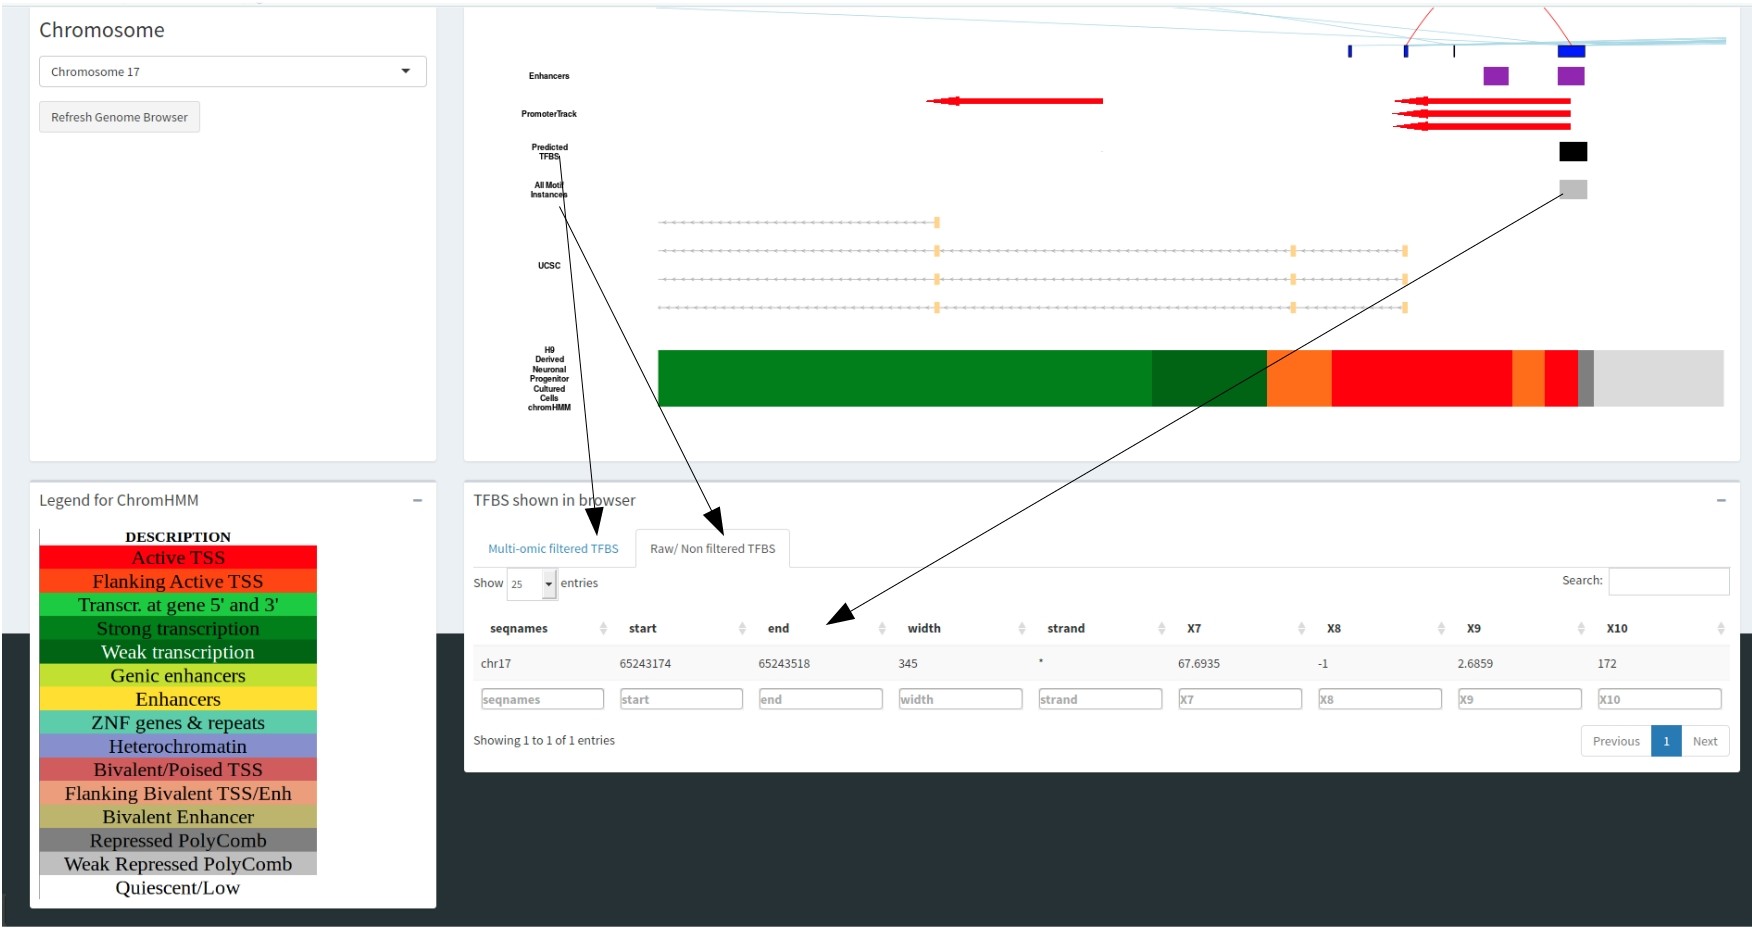
The predicted motif track correlates with the datatable below showing the information regarding these motifs.
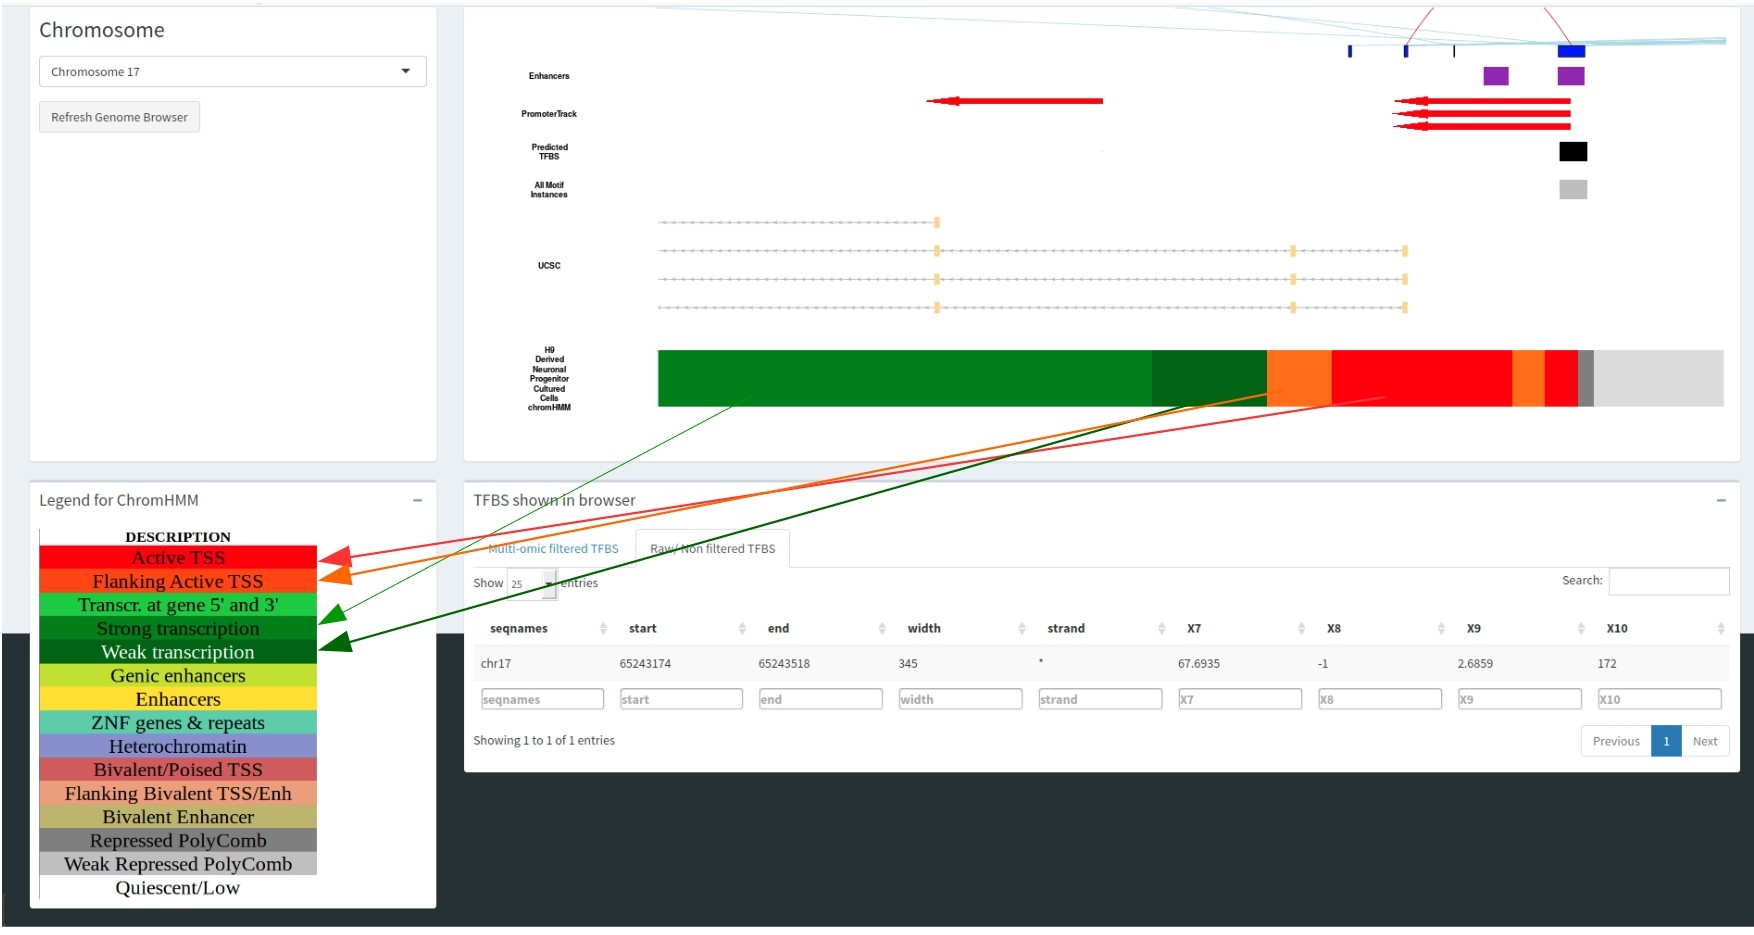
The colour of the Selected cell type track correlates with the chromHMM legend, informing you of the epigenomic state for each genomic region. This is illustrated in the figure where the dark green region correlates with active transcription and the red region is an active transcription start site.
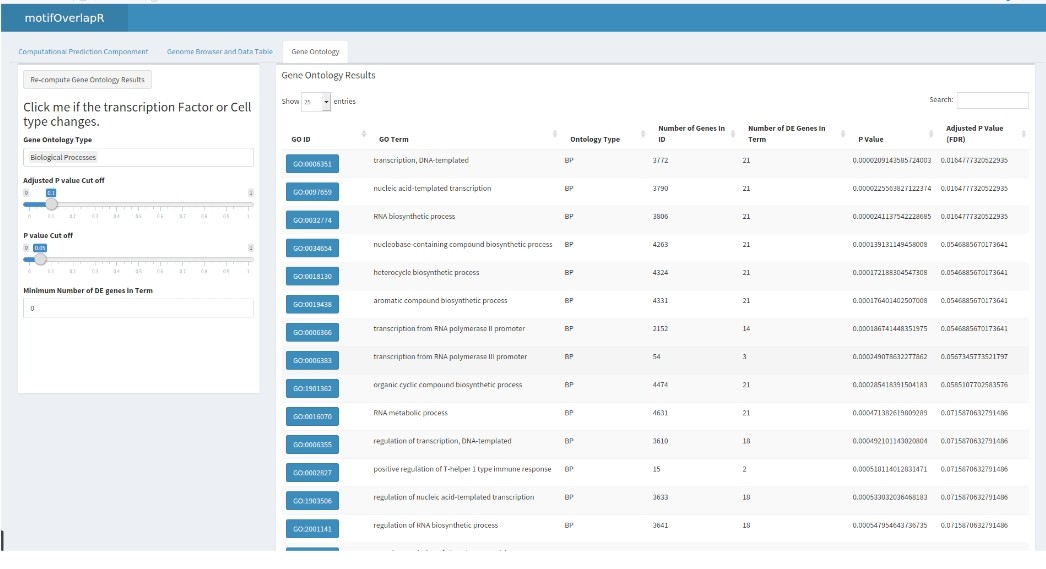
motifOverlapR also contains a gene ontology tab that conducts an enrichment based on the UCSC gene transcripts that are predicted to be regulated by the predicted TFBS.
Here, we can see many activating ontology terms for the Arnt transcription factor.
DNA sequences for the human genome were identifed as those in the UCSC BSgenome package.
The Bioconductor Dev Team (2014). BSgenome.Hsapiens.UCSC.hg19: Full genome sequences for Homo sapiens (UCSC version hg19). R package version 1.4.0.
Transcription factor matrices were downloaded off of Jaspar database.
Zhao et al (2013), JASPAR 2013: An extensively expanded and updated open-access database of transcription factor binding profiles.
Conservation data was downloaded using the UCSC FTP server.
The human genome browser at UCSC., Kent WJ, Sugnet CW, Furey TS, Roskin KM, Pringle TH, Zahler AM, Haussler D, Genome Res. 2002 Jun; 12(6) 996-1006, DOI: 10.1101/gr.229102. Article published online before print in May 2002, PMID: 12045153, PMCID: PMC186604
Chromatin state maps were donwloaded from the epigneomics roadmap using annotationHub R package.
Chromatin architecture reorganization during stem cell differentiation. Dixon JR, Jung I, Selvaraj S, Shen Y, Antosiewicz-Bourget JE, Lee AY, Ye Z, Kim A, Rajagopal N, Xie W, Diao Y, Liang J, Zhao H, Lobanenkov VV, Ecker JR, Thomson JA, Ren B, Nature. 2015 Feb 19; 518(7539) 331-336, DOI: 10.1038/nature14222, PMID: 25693564, PMCID: PMC4515363
The permissve enhancer Track was downloaded off of fantom5 database. The enhancer targets were identified using the cell type CAGE enhancer-promoter association data from fantom5 database.
Gateways to the FANTOM5 promoter level mammalian expression atlas. Lizio M, Harshbarger J, Shimoji H, Severin J, Kasukawa T, Sahin S, Abugessaisa I, Fukuda S, Hori F, Ishikawa-Kato S, Mungall CJ, Arner E, Baillie JK, Bertin N, Bono H, de Hoon M, Diehl AD, Dimont E, Freeman TC, Fujieda K, Hide W, Kaliyaperumal R, Katayama T, Lassmann T, Meehan TF, Nishikata K, Ono H, Rehli M, Sandelin A, Schultes EA, 't Hoen PA, Tatum Z, Thompson M, Toyoda T, Wright DW, Daub CO, Itoh M, Carninci P, Hayashizaki Y, Forrest AR, Kawaji H, FANTOM consortium, Genome Biol. 2015 Jan 05; 16 22, DOI: 10.1186/s13059-014-0560-6, PMID: 25723102, PMCID: PMC4310165
MotifOverlapR: multi-omic transcription factor binding site filtration and visualization
Transcription Factors, Multi-omic integration Awais Choudhry1,2, Stephen Martin Pederson2, Cheryl Shoubridge1 & Jimmy Breen1,2, * 1 Robinson Research Institute, University of Adelaide 2 University of Adelaide Bioinformatics Hub, School of Biological Science, University of Adelaide
- Corresponding author: Jimmy Breen (jimmy.breen@adelaide.edu.au)