Introduction:
Obesity is a prevalent issue in the United States, affecting approximately 40% of adults and almost 20% of children. The negative consequences of obesity include increased risks of diabetes, heart disease, stroke, and various forms of cancer. As part of this project, I will analyze the rates of mortality due to diabetes and cardiovascular diseases in different states across the USA and examine how the obesity rates in those states relate to these causes of death.
Repository Contents and Instructions:
The repository consists of mortality data taken from the Center for Disease Control and Prevention (CDC) website for the years 2018-2021. The obesity data taken from Behavioral Risk Factor Surveillance System (BFRSS) for the years 2018 to 2021.
Input Data
In order to run the project, one will need to create a subdirectory named "input" under the "Data" directory and place the following files with the exact names given below. To get the mortality data one will go to CDC wonder link given below. After agreeing to the query, under section "Organise the table layout" choose group results by "State". Then under the section "Cause of death" choose for "all causes" and export the data. Same steps will be carried out for mortality data due to "Diseases of the circulatory system" and mortality data due to "Endocrine, nutritional and metabolic diseases."
- Mortality data: The mortality data consists of mortality rates overall in the USA states from 2018 to 2021. Mortality rates due to diabetes and mortality rates due to cardiovascular disease in the USA states from 2018 to 2021.
- Underlying Cause of Death, 2018-2021, Single Race All.txt
- Underlying Cause of Death, 2018-2021, Single Race Circulatory.txt
- Underlying Cause of Death, 2018-2021, Single Race Endocrine.txt
Underlying Cause of Death, 2018-2021, Single Race Request (cdc.gov)
- Obesity Data: It consists of obesity data collected from Behavioral Risk Factor Surveillance System for years 2018 to 2021.
- LLCP2018.ASC_
- LLCP2019.ASC_
- LLCP2020.ASC_
- LLCP2021.ASC_
CDC - BRFSS Annual Survey Data (2018 ASCII File)
CDC - BRFSS Annual Survey Data (2019 ASCII File)
CDC - BRFSS Annual Survey Data (2020 ASCII File)
CDC - BRFSS Annual Survey Data (2021 ASCII File)
BRFSS codebook link for variable layout position in the ASCII format file (fixed length file)
LLCP 2018 Codebook Report (cdc.gov) for 2018
Output Data The project creates the following output files
-
MortalityData.csv:
This file contains crude mortality rate for each state and their respective obesity percentage.
-
regplot.png:
Regression analysis with 90% confidence interval showing the trend in obesity with mortality due to cardiovascular and diabetes.
-
scatter_plot.png:
Correlation between obesity and mortality due to diabetes and cardiovascular disease.
-
mortality_us_state_popn.png:
This qgis map shows the overall crude rate of mortality over population in each state.
-
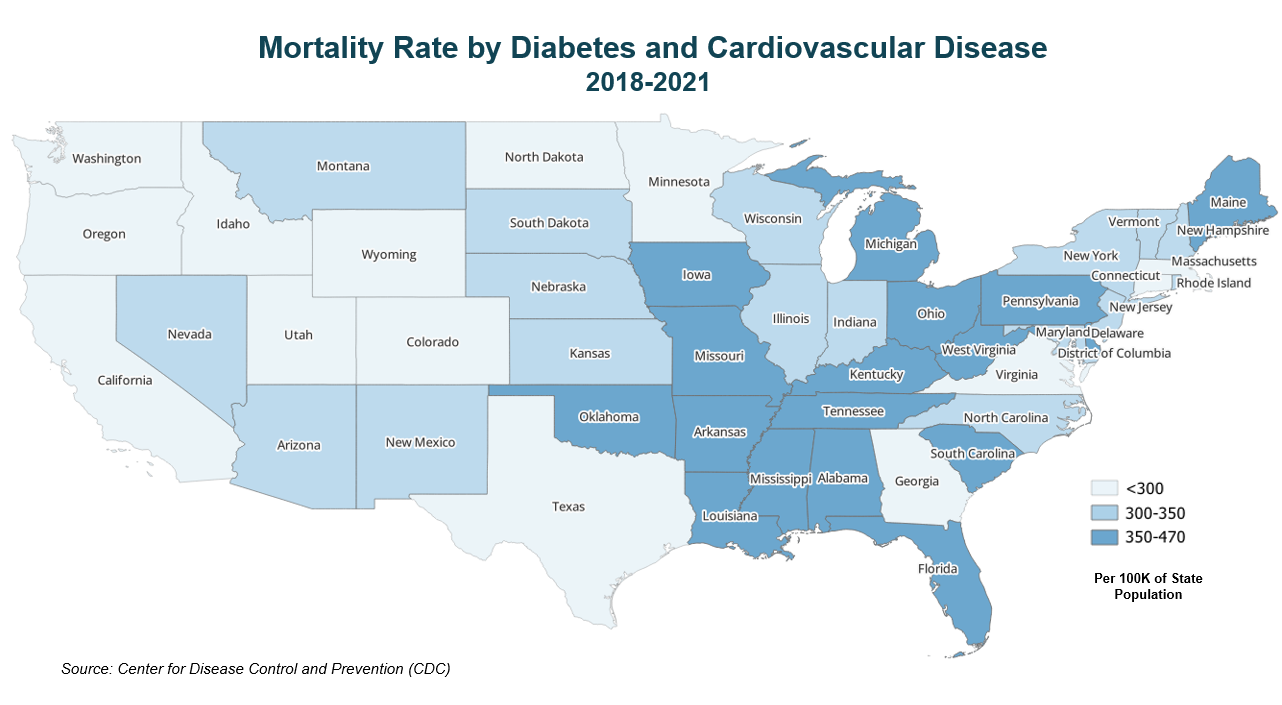
mortality_by_condition.png:
This qgis map shows the overall crude rate of mortality with respect to diabetes and cardiovascular disease over population in each state.
-
obesity.png:
This qgis map shows the overall percentage of obesity in each state.
-
mortality_obesity.png:
The qgis map shows the nine color ramp correlation between obesity percentage and mortality by diabetes and cardiovascular disease.
Scripts:
main.py will be executed first, as it comprises of multiple python scripts. Individual scripts are explained below.
-
common.py In this script we are holding common functions.
-
mortality.py This script reads 3 types of state mortality data overall, heart disease and diabetes from the input csv files. It cleans the data and merge all of it together calculating crude mortality rates for each state in each category.
-
obesity.py In this script, Behavioral Risk Factor Surveillance System (BRFSS) data is read from individual years (2018-2021) and cleaned. Obesity rates are calculated for each year and then overall for all the states.
-
chart.py The relationship between obesity and mortality due to diabetes and cardiovascular disease has been shown through the scatter plot and regression analysis is run at 90% confidence interval for the trend line by regression plot.
-
main.py (this should be executed first) It is the main starting file. It processes the mortality and obesity data using the above scripts and create an output csv file. The output csv contains mortality crude rate and obesity percentage for each state. This output file serves as the basis for our analysis.
Images/Maps:
Apart from the two charts of scatter plot and regression in python, I made four maps on qgis showing state wise mortality, State wise obesity, state wise mortality due to the diabetes and cardiovascular disease and a color ramp showing prevalence of obesity and mortality due to diabetes and heart disease.


Key Findings:
High mortality rates due to cardiovascular disease and diabetes are found in states with high rates of obesity. This relationship is confirmed by a correlation analysis between obesity and mortality due to diabetes and cardiovascular disease, and further strengthened by a regression analysis with a 90% confidence level. These findings underscore the importance of addressing the growing trend of obesity in the United States. Over 60% of U.S. states have an obesity prevalence greater than 30% in their population, highlighting the urgent need for effective interventions to combat this major health issue.
With our analysis we can also conclude that if obesity is the driving factor of deaths due to diabetes and cardiovascular diseases then these deaths are preventable if obesity can be tackled effectively. One promising avenue is to investigate the role of Social Determinants of Health (SDOH), which refer to the environmental conditions individuals are exposed to throughout their lives, including their places of residence, education, work, leisure, and religious activities. These factors can exert a substantial influence on people's health, well-being, and susceptibility to various health outcomes, as recognized by the CDC.
Some examples of social determinants of health that can impact obesity rates include:
-
Access to healthy food: Limited access to affordable, healthy food options in low-income neighborhoods and food deserts can contribute to obesity rates. Access to healthy and affordable food options in low-income neighborhoods can be improved through policies and initiatives that incentivize grocery stores and farmers' markets to open in these areas.
-
Physical activity: Increasing access to safe and affordable places for physical activity, such as parks and community centers, can help reduce obesity rates.
-
Education: Providing education on healthy eating and physical activity can help reduce obesity rates.
-
Social support: Lack of social support can contribute to obesity rates, as individuals may not have the support, they need to maintain a healthy lifestyle. Increasing social support through community programs and support groups can help reduce obesity rates.
-
Income and poverty: Poverty stricken individuals may not have the resources to access healthy food options or engage in physical activity. Increasing access to resources and addressing poverty can help reduce obesity rates.
It is important to note that addressing obesity requires a comprehensive approach that involves multiple sectors, including healthcare, education, community development, and government policies.
What strategies have states with lower obesity rates implemented?
From our analysis, some of the states with less than 30% obesity rates are Washington, Colorado, Utah and Wyoming to name a few. Some of the noteworthy policies they have implemented to curb obesity in their states are:
All four states (Washington, Colorado, Utah, and Wyoming) have policies to support active transportation, including bike lanes, pedestrian-friendly sidewalks, and trails. For instance, Colorado's Complete Streets policy requires transportation planners and engineers to consider the needs of all users, such as bicyclists, pedestrians, and motorists.
Washington has implemented the National School Lunch Program (NSLP) to provide nutritious meals to children and promote their health and well-being.
The "Eat Well Utah" initiative, launched by the Utah Department of Health and Human Services, aims to increase the availability and appeal of healthy food choices at all food service and retail locations across the state.
Colorado has implemented a menu labeling law that requires chain restaurants to display the calorie content of their menu items.
Way Forward:
In future, as we strive to mitigate the prevalence of obesity and its associated health outcomes, it is imperative that we continue to explore and implement effective public policies that address the social determinants of health. Future research can delve deeper into the needs and demographics of individuals in obesity prevalent regions, paving the way for targeted interventions that address the root causes of obesity. As we move forward, it is essential to remember that obesity and its related health conditions are preventable, and by working together, we can create a healthier, more equitable society for all.