This is a demo of making great circle plots in R from airport codes using a very bad map projection. I mean the point is, it's cool looking. Map, archs, points, geo-locating. Pretty neat. Get a dump of your fight data and map where you've been and what airline.
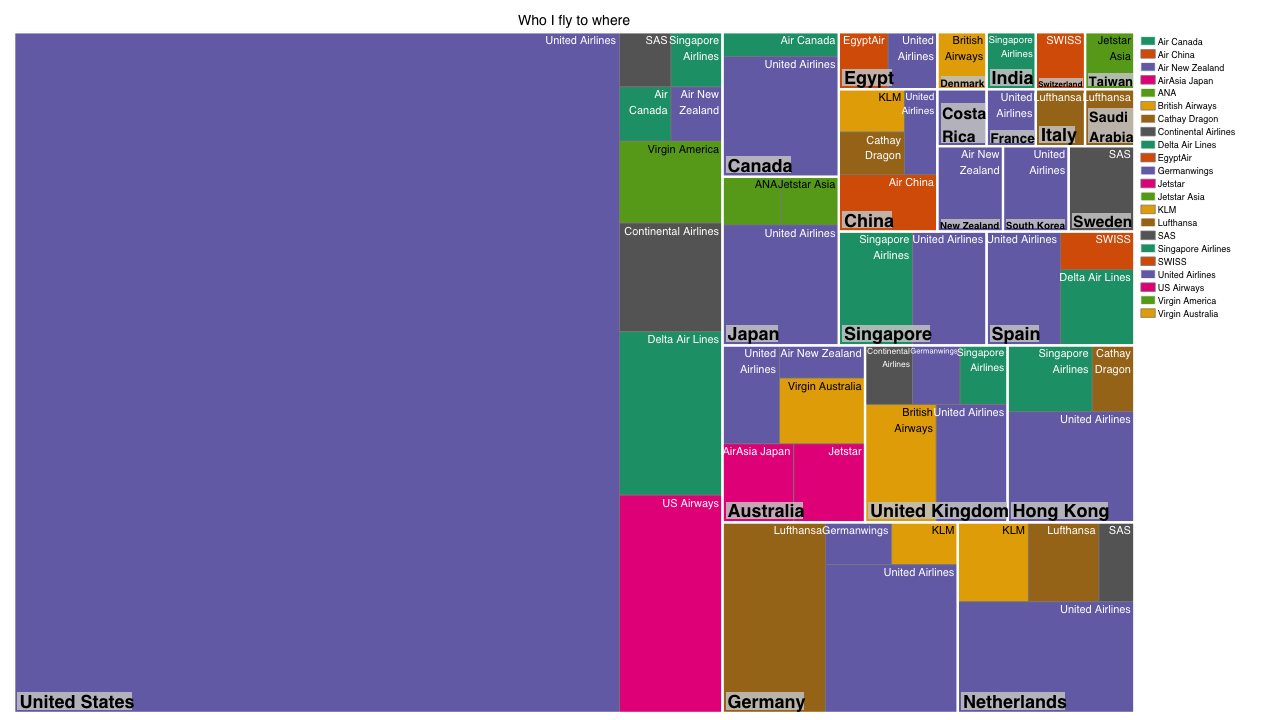
Then you'll realize, while pretty, it's kinda worthless as a visual. So then we make a treemap. None of that pesky math, and it tells you much easier where you go and on what carrier.
The code here is setup to use a dump from openflights.org but the sample data is just a subset. The full code is inline and commented out if you get a full export. We'll make a pretty map with great circle plots to show you every where you flew. Then we'll break it down by carrier.
For the point of this instructional, you'll need the following librarires:
carmapsggplot2geosphereparalleltreemap
The parallel package is just fun of it really. I mean I have
several cores, why not use most of them. The code itself is documented
explaining the step by step. Just source the start.R code. This
code was put together for a talk to
the Singapore R Users group
and then expanded for
a
WWW 2017 tutorial
The data in flights.csv is fictional. Just so you know that Virgin
America doesn'tdidn't have a SFO to SFO flight. There are several good
Airport Databases
around the web too.