This project creates an application running Prometheus, Grafana and Node Exporter and can self-monitor. To add additional node targets, simply add the node_exporter folder to any other project and add a Device Environment variable via the balenaCloud dashboard to update the docker-compose.yml file, as shown in Monitor other devices below.
/balena-prometheus-grafana/
├── grafana
│   ├── Dockerfile.template
│   └── conf
│         └── dashboard.yml
│         └── dashboard_node_exporter.json
│         └── datasources.yml
├── node_exporter
│   └── Dockerfile.template
├── prometheus
│   ├── Dockerfile.template
│   └── prometheus.yml
│   └── shart.sh
├── docker-compose.yml
├── README.md
In order to work properly, Prometheus needs at least a minimal prometheus.yml file with basic global and scrape_config entries. The following is used in this project:
global:
  scrape_interval: 15s
  evaluation_interval: 15s
  scrape_timeout: 10s

scrape_configs:
  - job_name: prometheus
    honor_timestamps: true
    scrape_interval: 15s
    scrape_timeout: 10s
    metrics_path: /metrics
    scheme: http
    static_configs:
    - targets:
      - prometheus:9090
  - job_name: node_exporter
    honor_timestamps: true
    scrape_interval: 15s
    scrape_timeout: 10s
    metrics_path: /metrics
    scheme: http
    static_configs:
    - targets: ['node_exporter:9100']
Two networks are used. The frontend network enables external connections to ports 3000, 9090 and 9100 on the Prometheus service to enable requests to and from Grafana (3000), Prometheus (9090) and Node Exporter (9100). The backend network enables the local name resolution of node_exporter. However, all networks could be set as network_mode: host for simplicity, and on other devices that aren't resolvable on the Prometheus/Grafana node.
Note that the architecture of Prometheus is set as an "ARCH" argument defined in each Dockerfile.template. This should be updated with the appropriate version for your architecture. RPi 3 requires armv7. Pi4 and NUC devices should use arm64.
In order to add monitoring of other devices, add the following to its separate docker-compose.yml file:
# Add Node Exporter to this app
  node_exporter:
    build: ./node_exporter
    ports:
      - "9100:9100"
    network_mode: host
    container_name: node_exporter
Secondly, add the ./node_exporter folder to that application, with a Dockerfile.template that looks like this:
FROM balenalib/%%BALENA_MACHINE_NAME%%-alpine
WORKDIR /app

RUN echo "http://dl-cdn.alpinelinux.org/alpine/edge/testing/" >> /etc/apk/repositories && \
    apk add --no-cache prometheus-node-exporter

# Expose the port Prometheus uses
EXPOSE 9100

# Start Node Exporter
CMD [ "/usr/bin/node_exporter" ]
Finally, add a new entry in the balenaCloud Device Variables for the application running Prometheus (and Grafana). Add the variable TARGETS and enter values that are the host IP addresses and ports of the devices you want to monitor, such as 10.128.1.134:9100, 10.128.1.211:9100, etc. Spaces are optional.
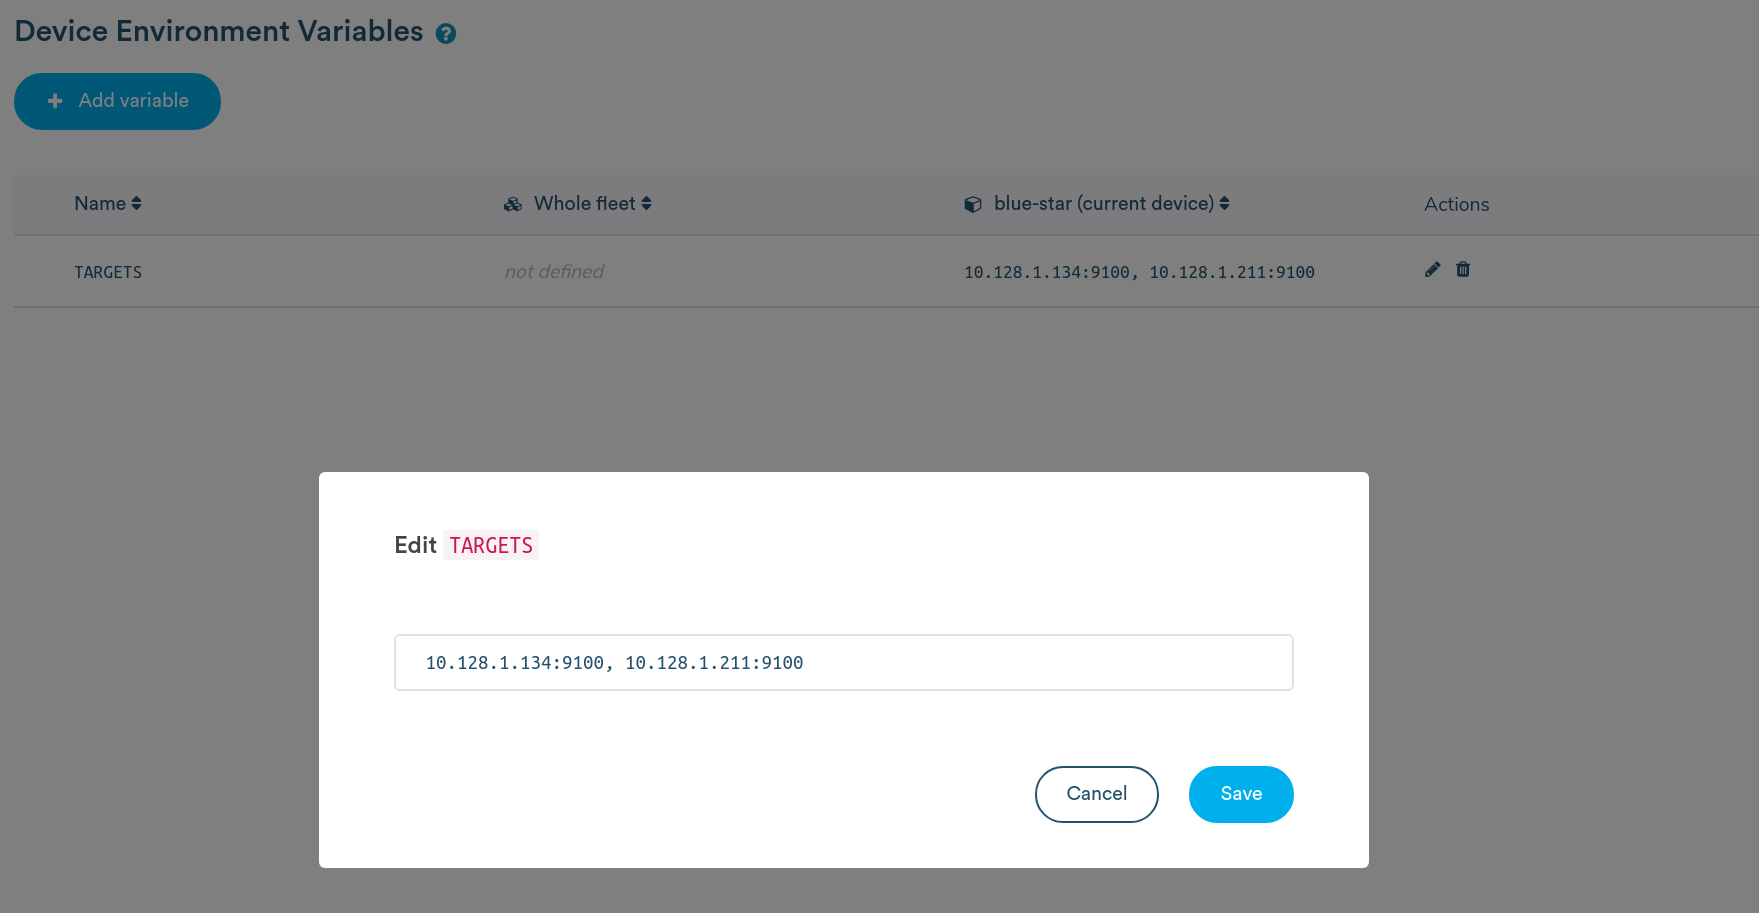
Each target address will show up in your Prometheus targets, http://prometheus-IP/targets.
Clone this repository, change into the balena-prometheus-grafana directory and push to your application:
 $ git clone git@github.com:balenalabs-incubator/balena-prometheus-grafana.git
 $ cd balena-grafana
 $ balena push <appname>
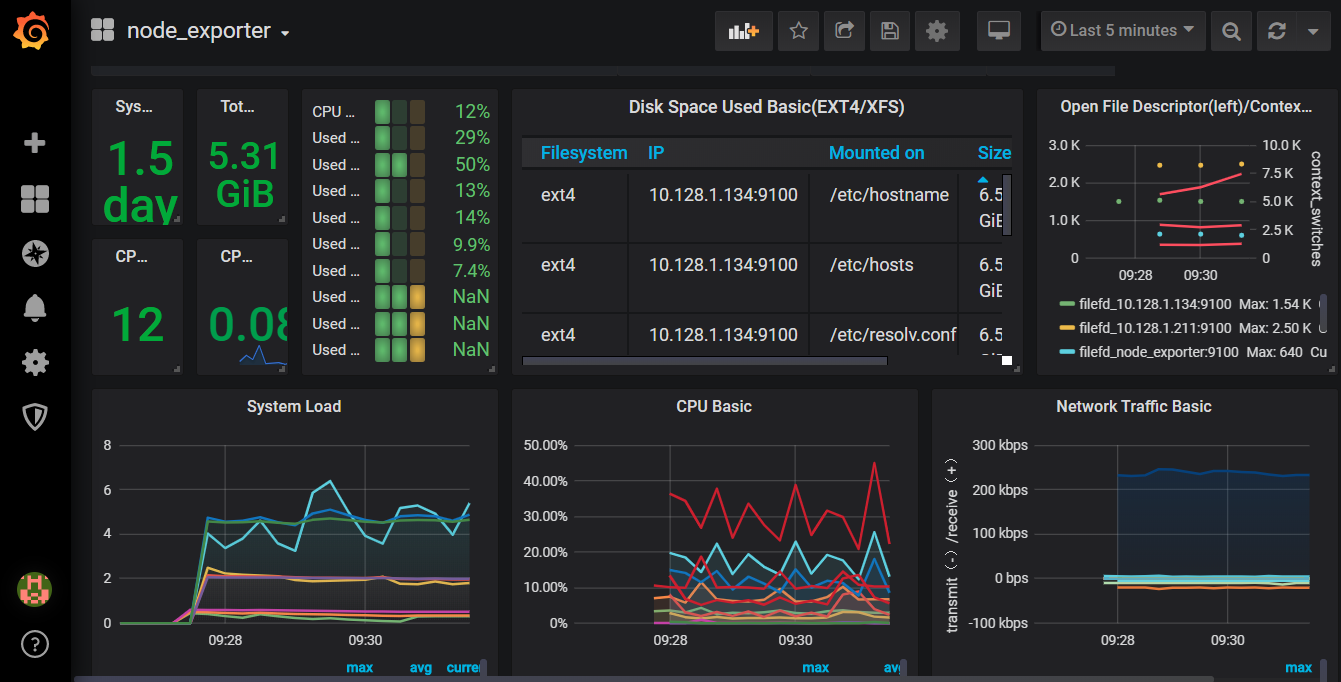
In order to start viewing system data, log in to the Grafana dashboard at http://device-host-ip:3000 with admin/admin. Set a password. Since this deployment automatically sets up the Prometheus datasource and the Node Exporter dashboard, you're done. Once you login, you can view graphical data by clicking on the Dashboard menu item and then on "Node Exporter".