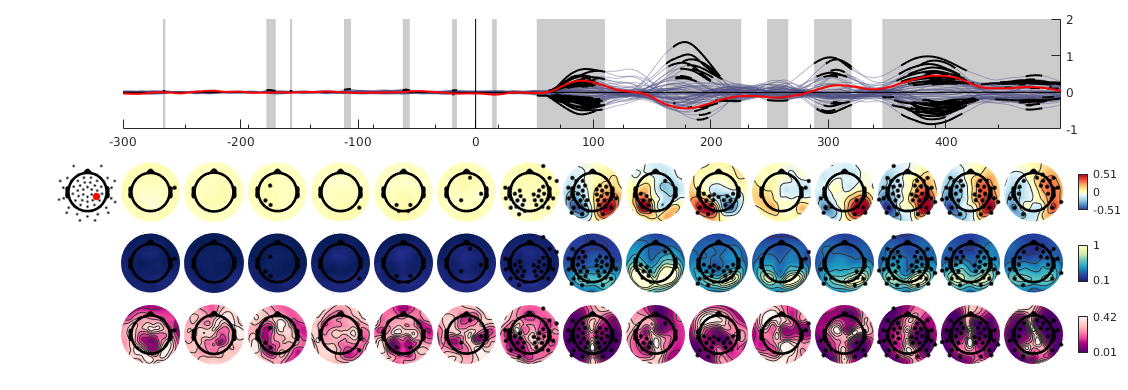
There will be never a single visualization that captures all aspects of one's data. But here I will publish scripts, that do show the available data in a good way.
 This style was used in Ehinger et al 2015. It is useful for timeseries. It combines the benefits of topographies (spatial) with the butterfly (temporal) plots. Thus in the end you can present how the whole timeseries looks and in addition you show how it is spatially relating.
Please cite as: Ehinger, BV 2018 "EEGVIS toolbox"
MIT