The BelugaCDN Grafana Application plugin allows you to access available CDN site metrics through Grafana.
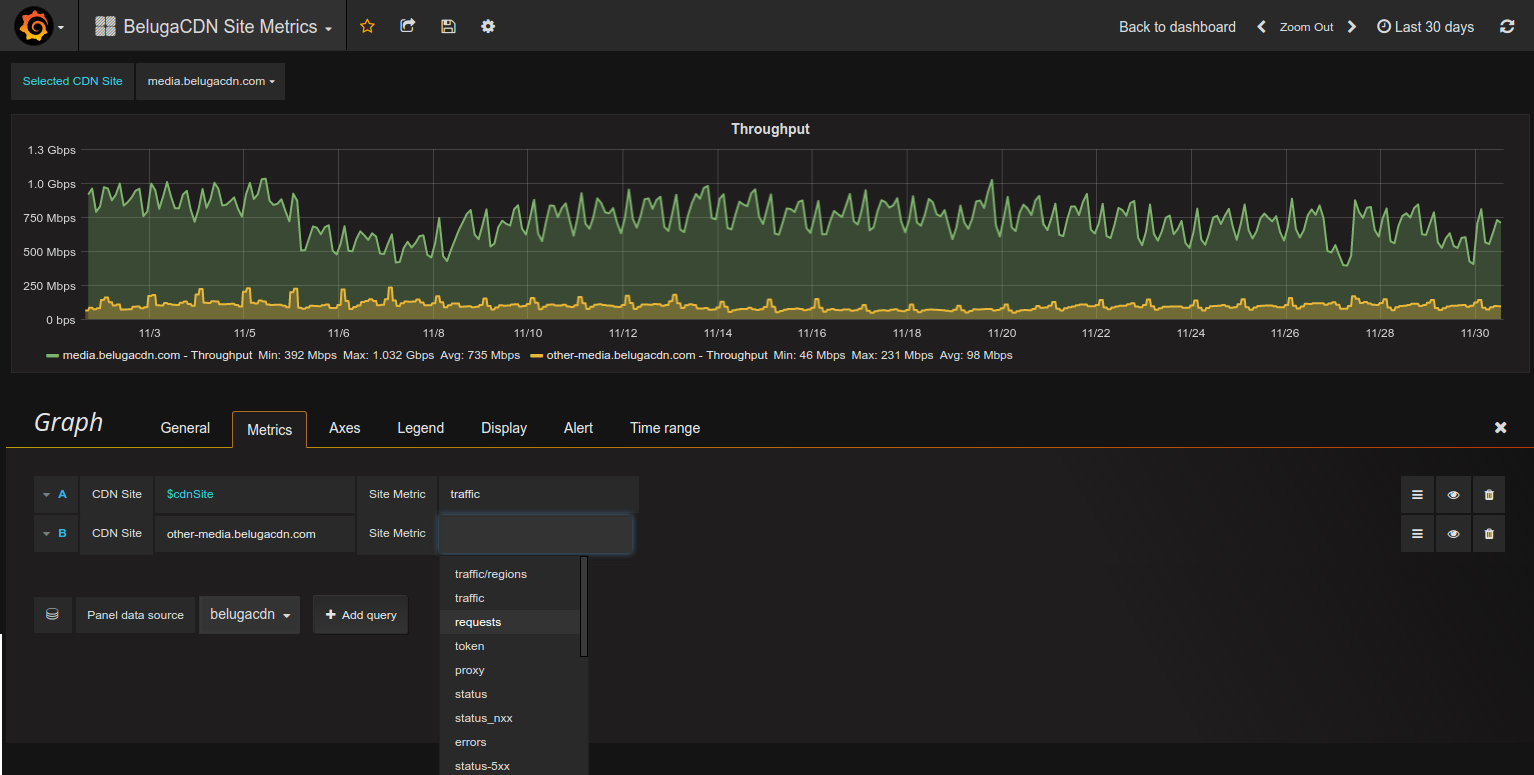

- Grafana Datasource to access all available metrics through the BelugaCDN API
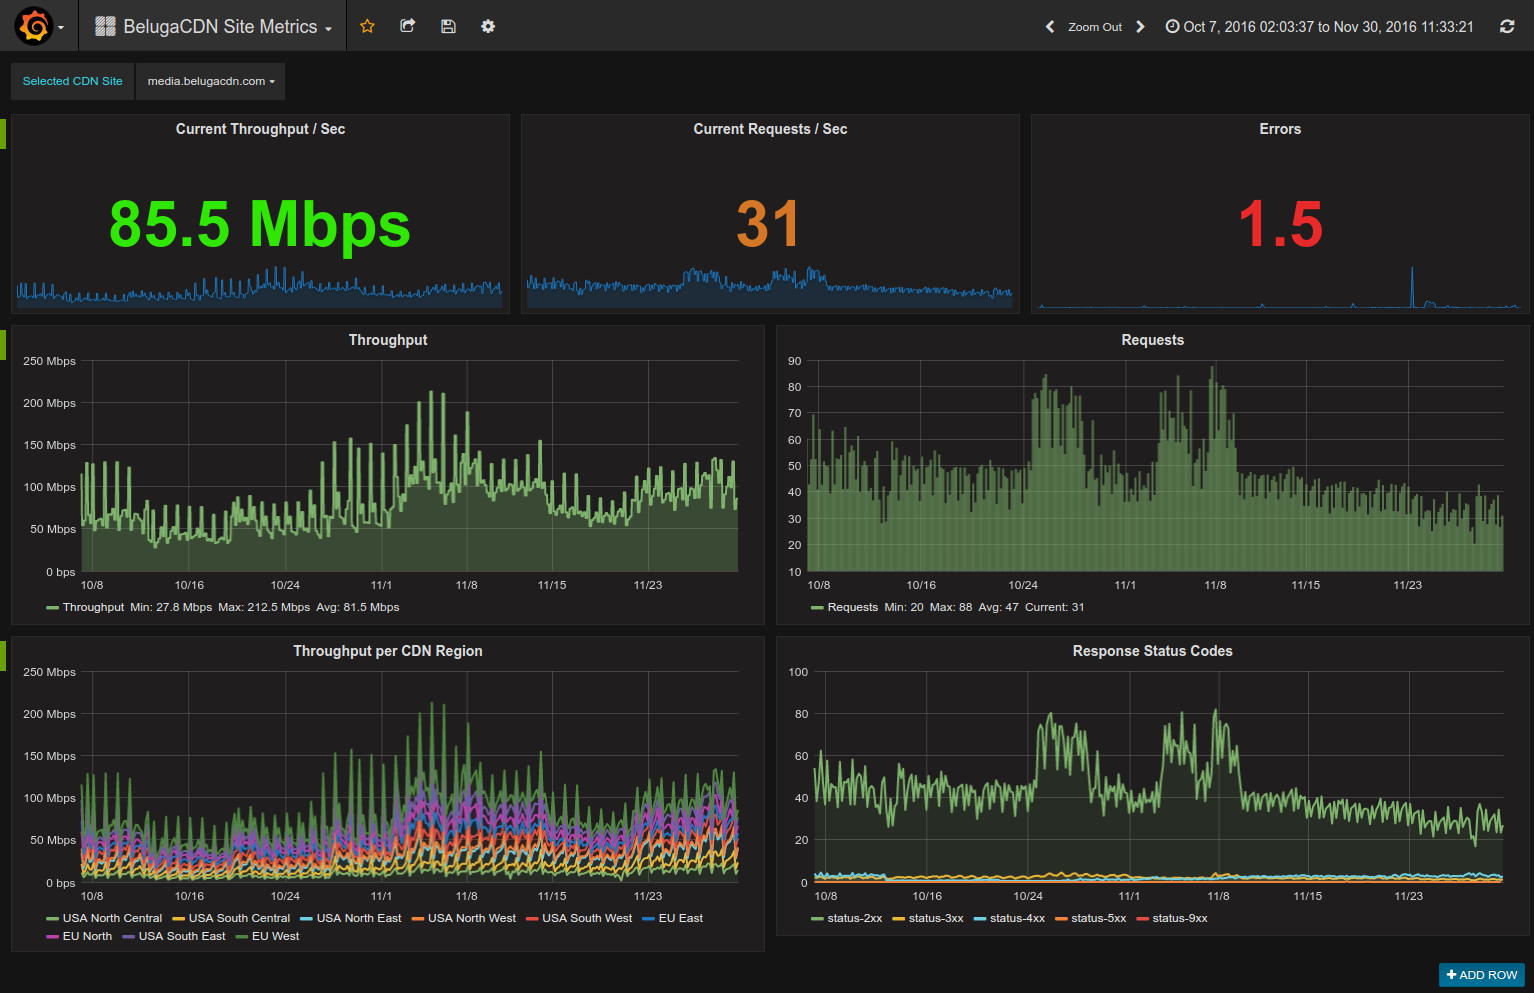
- BelugaCDN Metrics Dashboard giving an overview of your sites activity
- Current Requests & Throughput per Second
- Total Errors over time
- Requests breakdown by HTTP Status Code
- Traffic breakdown by CDN region
- support multiple Datasources per panel for more advanced graphing
- initial version with API based Grafana Datasource & example Dashboard
git clone https://github.com/belugacdn/grafana-belugacdn-app.gitin to/var/lib/grafana/plugins
git clone https://github.com/belugacdn/grafana-belugacdn-app.gitin todata/plugins
Restart the grafana-server afterwards for the plugin to show up.
Please submit any issues with the app on Github.