Metric Proxy is a Prometheus Aggregating Push Gateway designed for use in the ADMIRE project. It acts as an instrumentation proxy, collecting and aggregating metrics from various sources to provide a centralized view for monitoring and analysis
:::info Do this step only the first time you install :::
Simply run:
curl --proto '=https' --tlsv1.2 -sSf https://sh.rustup.rs | sh
#Answer "1" proceed to install to the question (or customize accordingly)You need:
- a python in env (python / python3)
- mpicc in env (any MPI but same as your app)
- Rust installed
git clone https://github.com/besnardjb/proxy_v2.gitSimply enter inside the source directory cd ./proxy_v2 and run ./install [PREFIX].
:::info
You may need to tweak the OpenSSL directory using export OPENSSL_DIR="/usr/local/ssl if there is an issue compiling the OpenSSL crate.
:::
git clone https://github.com/besnardjb/proxy_v2.git
cd proxy_v2
# Install the proxy (requires mpicc in the path)
./install.sh $HOME/metric-proxy
# Add the prefix to your path
export PATH=$HOME/metric-proxy/bin:$PATH
# Run the server (and keep it running)
proxy-v2
# Run the client in another shell1
proxy_run -j testls -- ls -R /
Then open http://localhost:1337
The new proxy (also called V2) shares several design approaches with the first iteration of its kind with the following changes:
- The proxy now includes an internal web-gui (by default at http://localhost:1337)
- The proxy is capable of creating a reduction tree for metrics
- Data are tracked per-job basis in real-time
- The proxy now includes the capability of tracking node state (node-level metrics)
The proxy_run command is to be used to run instrumented programs. This program supposed that a metric proxy is running on each of the target nodes.
Help is the following:
Usage: proxy_run [OPTIONS] [-- <COMMAND>...]

Arguments:
  [COMMAND]...  A command to run (passed after --)

Options:
  -l, --listexporters            List detected exporters
  -e, --exporter <EXPORTER>      List of exporters to activate
  -j, --jobid <JOBID>            Optionnal JOBID (MPI/SLURM may generate one automatically)
  -u, --unixsocket <UNIXSOCKET>  Optionnal path to proxy UNIX Socket
  -h, --help                     Print help
  -V, --version                  Print version
A basic usage is:
# MPIRUN
mpirun -np 8 proxy_run -- ./myprogram -XXX
# srun
srun -n 8 proxy_run -- ./myprogram -XXX
The metric proxy now supports jobs, you can force a job using the -j flag or resort to the slurm / mpirun default. Note, a job may have no jobid in some circumstances and thus not appear as a job if you open the job interface in http://localhost:1337/jobs.html.
For example if you do:
proxy_run -j testjob -- yes
now have a testjob line:
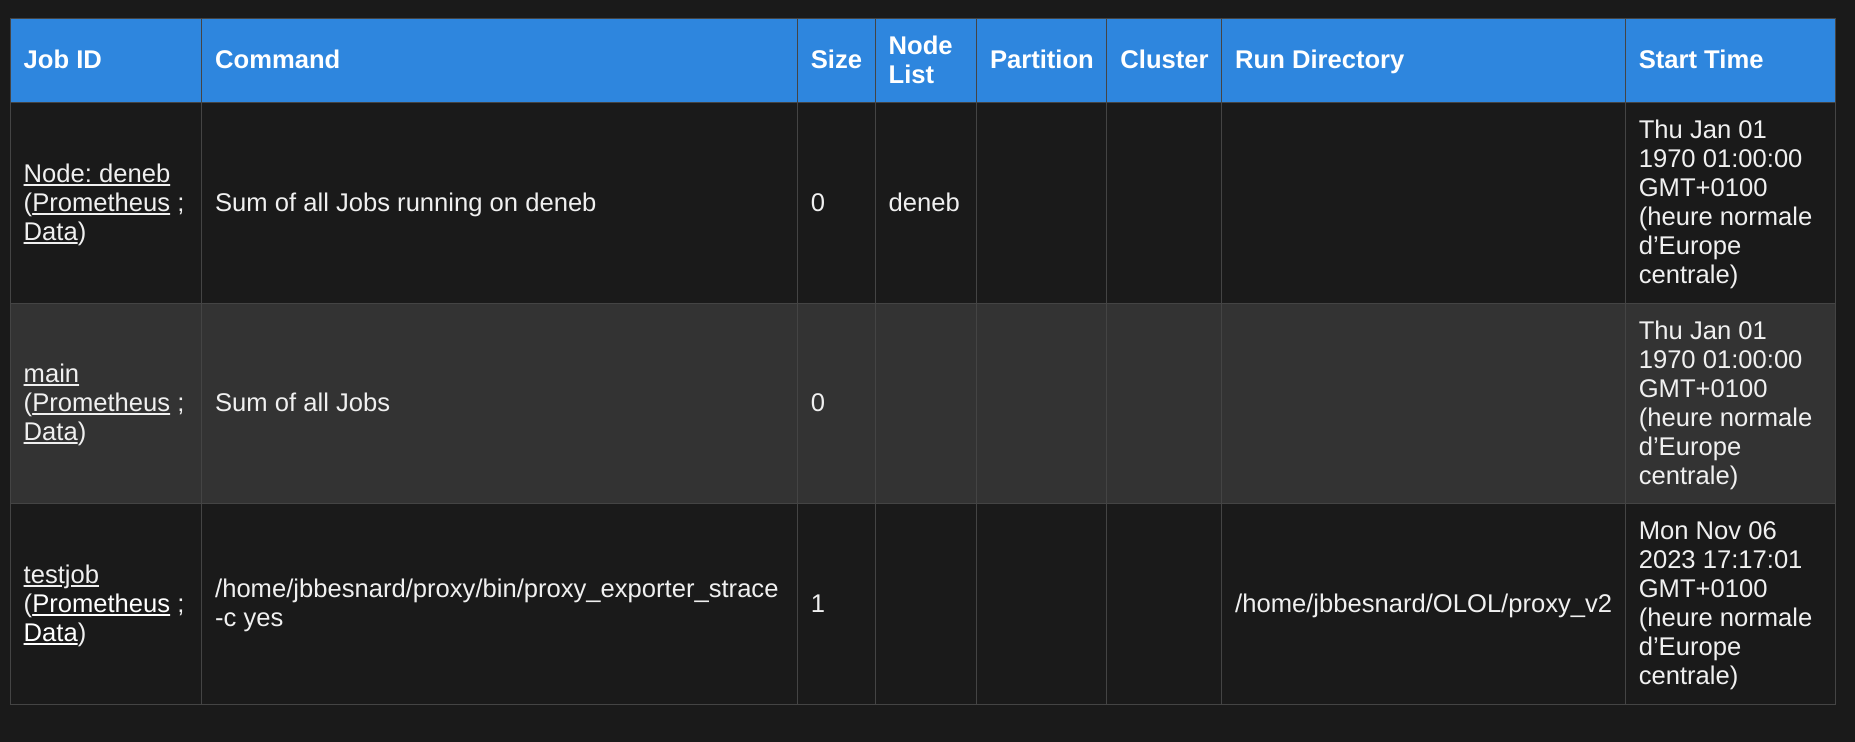
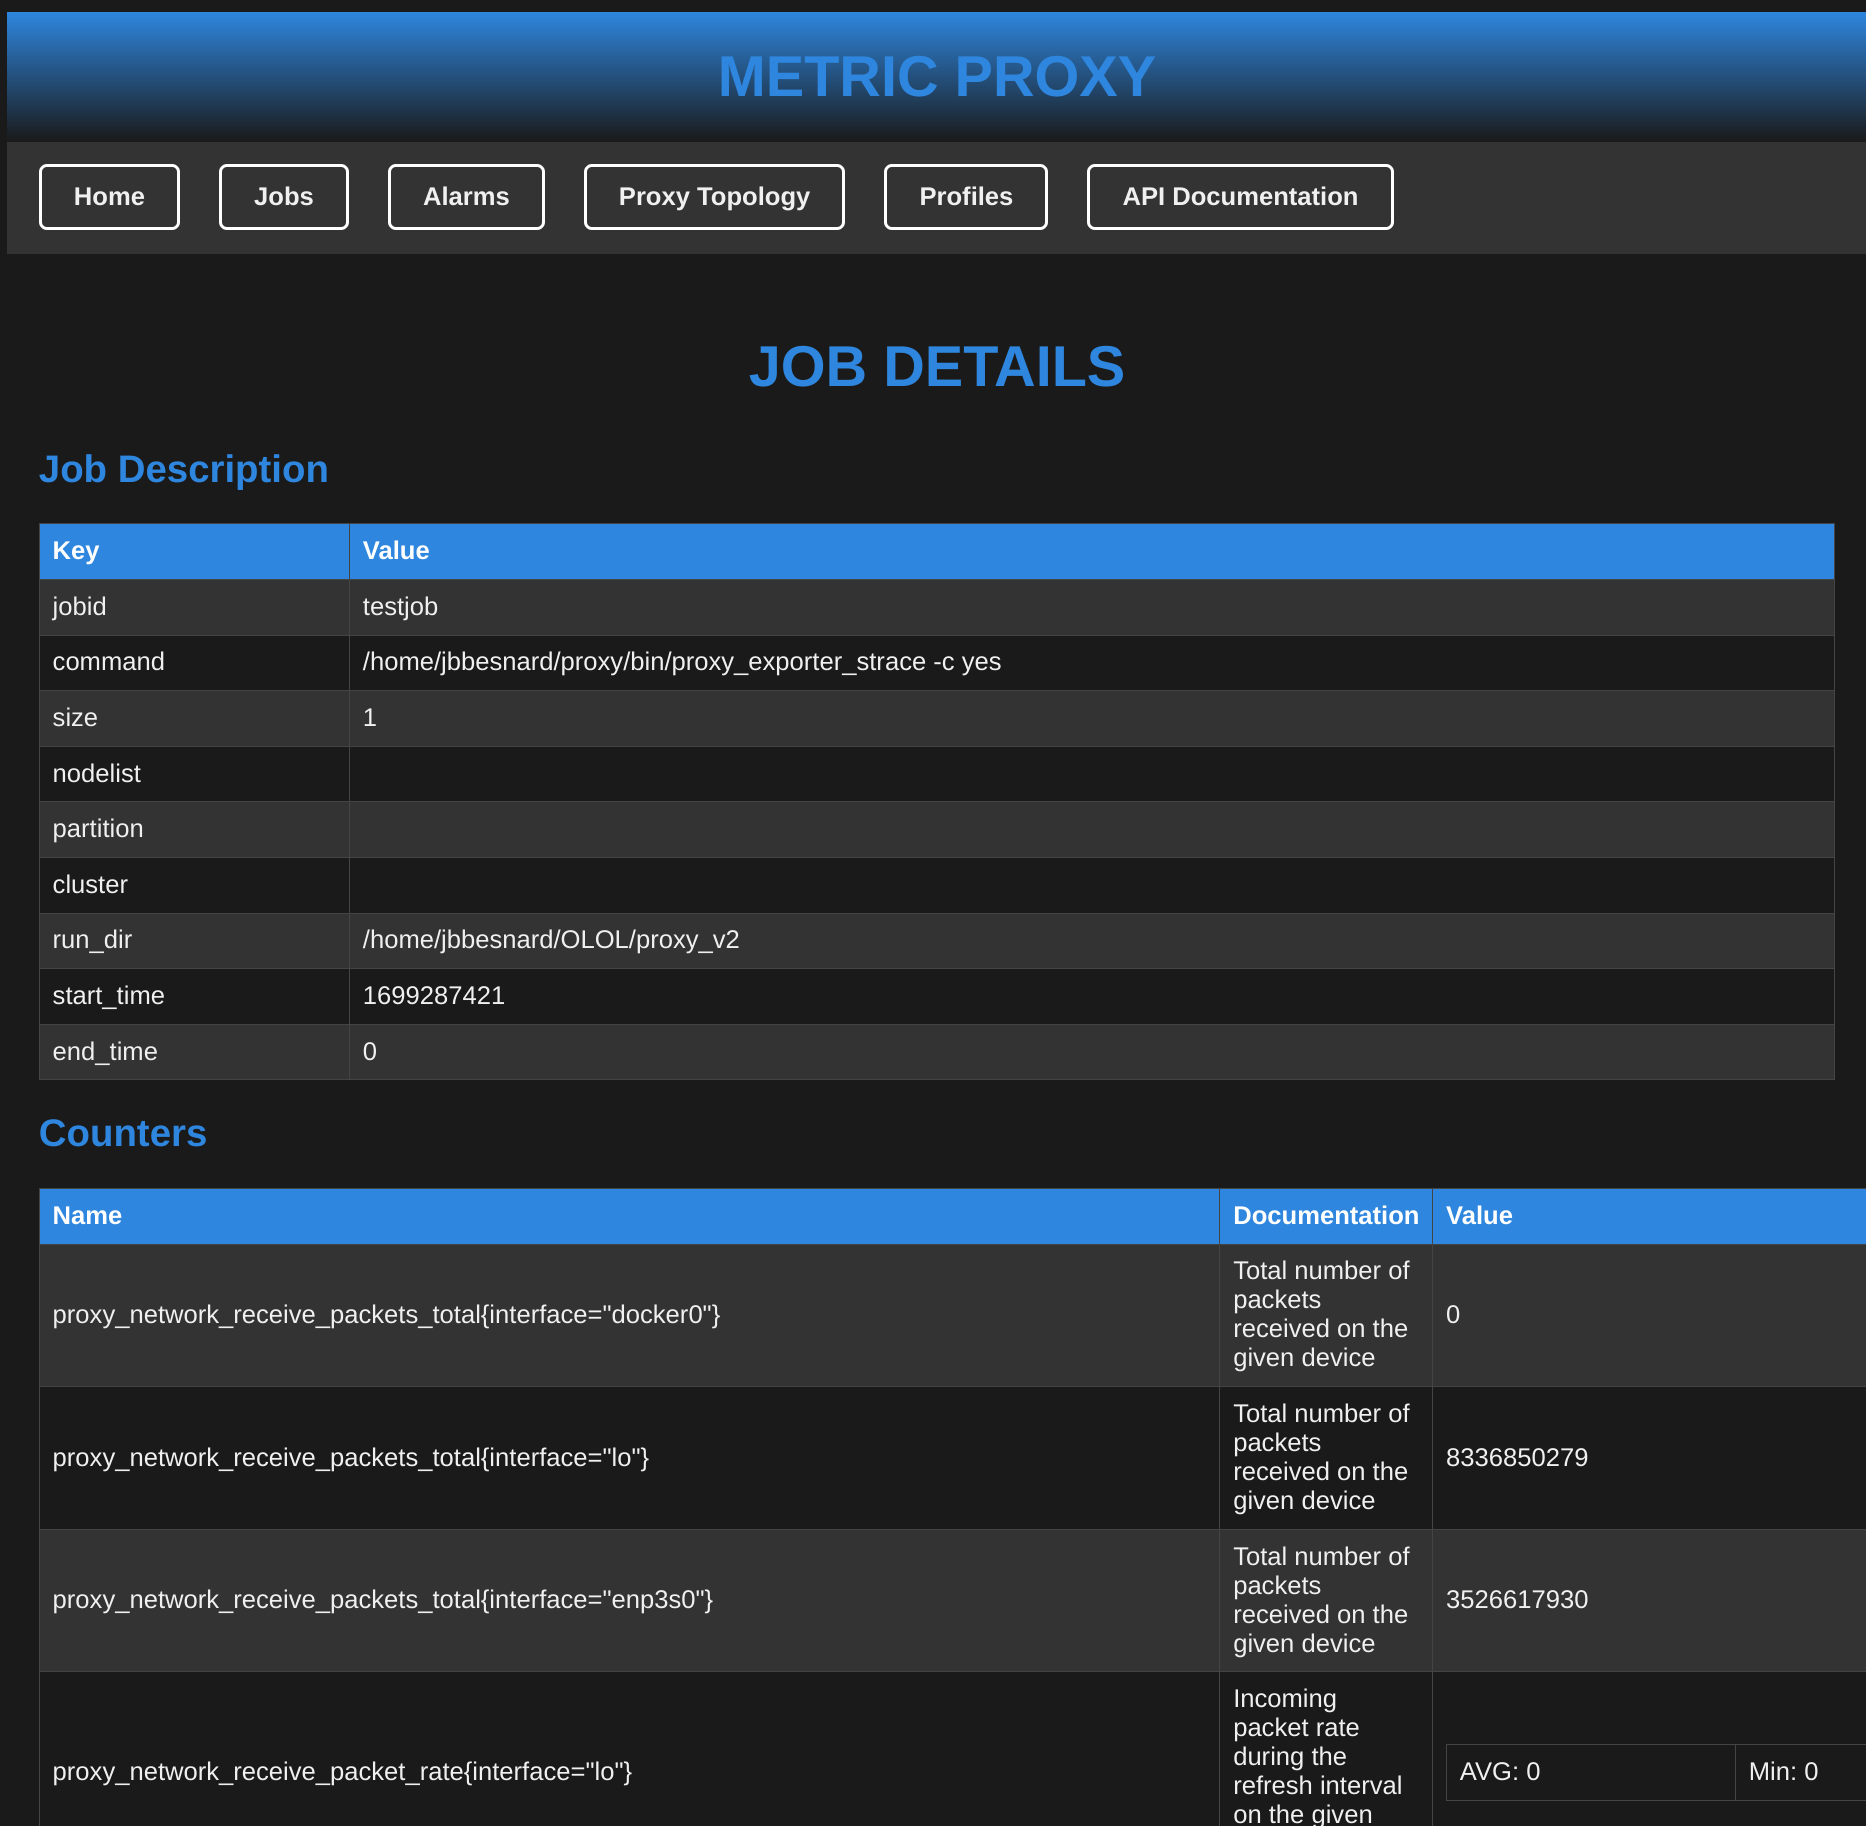
You can then click on testjob to see the metrics flowing:
:::info Both job metrics and node level metrics are collated in these metrics to ease the blaming of node performance on job performance. Note that node level metrics are transposed indiferently of a possible partial allocation. :::
Unlike previous proxy which exposed only Prometheus endpoint, we have reworked our approach to expose more structured data including for each job:
Job management offers the following endpoints:
- A list of current jobs and their metadata at http://127.0.0.1:1337/job/list
[
    {
        "jobid": "main",
        "command": "Sum of all Jobs",
        "size": 0,
        "nodelist": "",
        "partition": "",
        "cluster": "",
        "run_dir": "",
        "start_time": 0,
        "end_time": 0
    },
    {
        "jobid": "Node: deneb",
        "command": "Sum of all Jobs running on deneb",
        "size": 0,
        "nodelist": "deneb",
        "partition": "",
        "cluster": "",
        "run_dir": "",
        "start_time": 0,
        "end_time": 0
    }
]- A global view of all jobs all at once http://localhost:1337/job it includes all the data (metadata and counters)
[
{
    "desc": {
        "jobid": "main",
        "command": "Sum of all Jobs",
        "size": 0,
        "nodelist": "",
        "partition": "",
        "cluster": "",
        "run_dir": "",
        "start_time": 0,
        "end_time": 0
    },
    "counters": [
        {
            "name": "proxy_cpu_total",
            "doc": "Number of tracked CPUs by individual proxies",
            "ctype": {
                "Gauge": {
                    "min": 8,
                    "max": 8,
                    "hits": 1,
                    "total": 8
                }
            }
        },
        ...
    ]
},
{
    "desc": {
        "jobid": "Node: deneb",
        "command": "Sum of all Jobs running on deneb",
        "size": 0,
        "nodelist": "deneb",
        "partition": "",
        "cluster": "",
        "run_dir": "",
        "start_time": 0,
        "end_time": 0
    },
    "counters": [
        {
            "name": "proxy_network_receive_packets_total{interface=\"docker0\"}",
            "doc": "Total number of packets received on the given device",
            "ctype": {
                "Counter": {
                    "value": 0
                }
            }
        },
        ...
    ]
}
]-
A JSON export of jobs http://localhost:1337/job/?job=main it filters only the job of interest instead of returning the full array of jobs. It extracts the jobfrom the array given by http://localhost:1337/job and has the same structure.
-
A prometheus export for each job http://localhost:1337/metrics/?job=testjob. Note http://localhost:1337/metrics is the export of the main job and thus equivalent to http://localhost:1337/metrics/?job=main
You may set alarms to track values see the example GUI at http://127.0.0.1:1337/alarms.html.
We propose the following endpoints:
- http://127.0.0.1:1337/alarms : list current raised alarms
{
  "main": [
    {
      "name": "My Alarm",
      "metric": "proxy_cpu_load_average_percent",
      "operator": {
        "More": 33
      },
      "current": 51.56660318374634,
      "active": true,
      "pretty": "My Alarm : proxy_cpu_load_average_percent (Average load on all the CPUs) = 51.56660318374634 (Min: 51.56660318374634, Max : 51.56660318374634, Hits: 1, Total : 51.56660318374634) GAUGE > 33"
    }
  ]
}- http://127.0.0.1:1337/alarms/list : list all registered alarms
{
  "main": [
    {
      "name": "My Other Alarm",
      "metric": "proxy_cpu_load_average_percent",
      "operator": {
        "Less": 33
      },
      "current": 6.246700286865234,
      "active": true,
      "pretty": "My Other Alarm : proxy_cpu_load_average_percent (Average load on all the CPUs) = 6.246700286865234 (Min: 6.246700286865234, Max : 6.246700286865234, Hits: 1, Total : 6.246700286865234) GAUGE < 33"
    },
    {
      "name": "My Alarm",
      "metric": "proxy_cpu_load_average_percent",
      "operator": {
        "More": 33
      },
      "current": 6.246700286865234,
      "active": false,
      "pretty": "My Alarm : proxy_cpu_load_average_percent (Average load on all the CPUs) = 6.246700286865234 (Min: 6.246700286865234, Max : 6.246700286865234, Hits: 1, Total : 6.246700286865234) GAUGE > 33"
    }
  ]
}- http://127.0.0.1:1337/alarms/add : add a new alarm
:::info Takes a JSON object
{
    "name": "My Alarm",
    "target": "main",
    "metric": "proxy_cpu_load_average_percent",
    "operation": ">",
    "value": 33
}
You can make it with curl:
curl -s http://localhost:1337/alarms/add\
  -H "Content-Type: application/json" \
  -d '{ "name": "My Alarm", "target": "main", "metric": "proxy_cpu_load_average_percent", "operation": ">", "value": 33 }'
Operation can be "<" ">" and "=" to w.r.t. value.
:::
- http://127.0.0.1:1337/alarms/del : delete an existing alarm
:::info
-
Using the GET protocol:
- targetjob : name of the job
- name : name of the alarm
Example with Curl
# Be careful with the & in bash/sh
curl "http://localhost:1337/alarms/del?targetjob=main&name=My%20Alarm"
-
Using the POST protocol:
Send the following JSON:
{
    "target": "main",
    "name": "My Alarm",
}
Example with Curl:
curl -s http://localhost:1337/alarms/del \
  -H "Content-Type: application/json" \
  -d '{"target": "main", "name": "My Alarm"}'
:::
As exposed in the example GUI, for manipulating profiles (final snapshot of jobs) the folowing JSON endpoints are provided:
- http://127.0.0.1:1337/profiles a list of profiles on the system, data layout is a job description as shown in http://127.0.0.1:1337/joblist
- http://127.0.0.1:1337/percmd a list of profiles gathered by launch command to ease procesing by command
{
    "./command_a ": [
            {
                "jobid": "test2",
                "command": "./command_a ",
                "size": 1,
                "nodelist": "",
                "partition": "",
                "cluster": "",
                "run_dir": "/XXX/proxy_v2/client",
                "start_time": 1699020416,
                "end_time": 1699020421
            }
        ],
    "./command_b ": [
            {
                "jobid": "test1",
                "command": "./command_b ",
                "size": 1,
                "nodelist": "",
                "partition": "",
                "cluster": "",
                "run_dir": "/XXX/proxy_v2/client",
                "start_time": 1699020317,
                "end_time": 1699020398
            }
        ]
}
http://127.0.0.1:1337/get?jobid=XXX allows to get a given profile, layout is identical to a job JSON snapshot as exposed in http://localhost:1337/job/?job=main.
It is possible to request a proxy to scrape a given target. Currently the following targets are supported:
- Another proxy meaning you may pass the url to another proxy to have it collected by the current proxt
- A prometheus exporter, meaning the
/metricendpoint will be harvested, currently only counters and gauges are handled. In the case of prometheus scrapes, they are aggregated only in "main" and inside the "node" specific job.
Only the GET requests are supported using the to argument, for example:
http://localhost:1337/join?to=localhost:9100 will add the node exporter running on localhost (classically on http://localhost:9100) and the proxy is able to scrape such metrics.
You can get the list of current scrapes at http://localhost:1337/join/list
It consists in such JSON:
[
  {
    "target_url": "http://localhost:9100/metrics",
    "ttype": "Prometheus",
    "period": 5,
    "last_scrape": 1699010032
  },
  {
    "target_url": "/system",
    "ttype": "System",
    "period": 5,
    "last_scrape": 1699010032
  }
]
## Acknowledgments
This project has received funding from the European Union’s Horizon 2020 JTI-EuroHPC research and innovation programme with grant Agreement number: 956748