Skip to content
New issue

Have a question about this project? Sign up for a free GitHub account to open an issue and contact its maintainers and the community.

By clicking “Sign up for GitHub”, you agree to our terms of service and privacy statement. We’ll occasionally send you account related emails.

Already on GitHub? Sign in to your account

add a feature for memory tracing with tracy #8272

Merged
merged 1 commit into from Apr 17, 2023

Conversation

mockersf
Copy link
Member

Objective

Screenshot 2023-03-30 at 08 39 49

@hymm
Copy link
Contributor

hymm commented Mar 30, 2023

does this fix #6927?

@james7132
Copy link
Member

I tried this a while back. For whatever reason, it broke logging due to registering a logger/subscriber before logging initialization in bevy_log happens. Not sure if that's a problem here.

@hymm I think this only partially helps with monitoring memory usage and allocator usage (which we should be minimizing), but it doesn't let have detailed snapshots of memory to find what is using too much memory.

@james7132 james7132 added C-Performance A change motivated by improving speed, memory usage or compile times A-Diagnostics Logging, crash handling, error reporting and performance analysis labels Mar 30, 2023
@mockersf
Copy link
Member Author

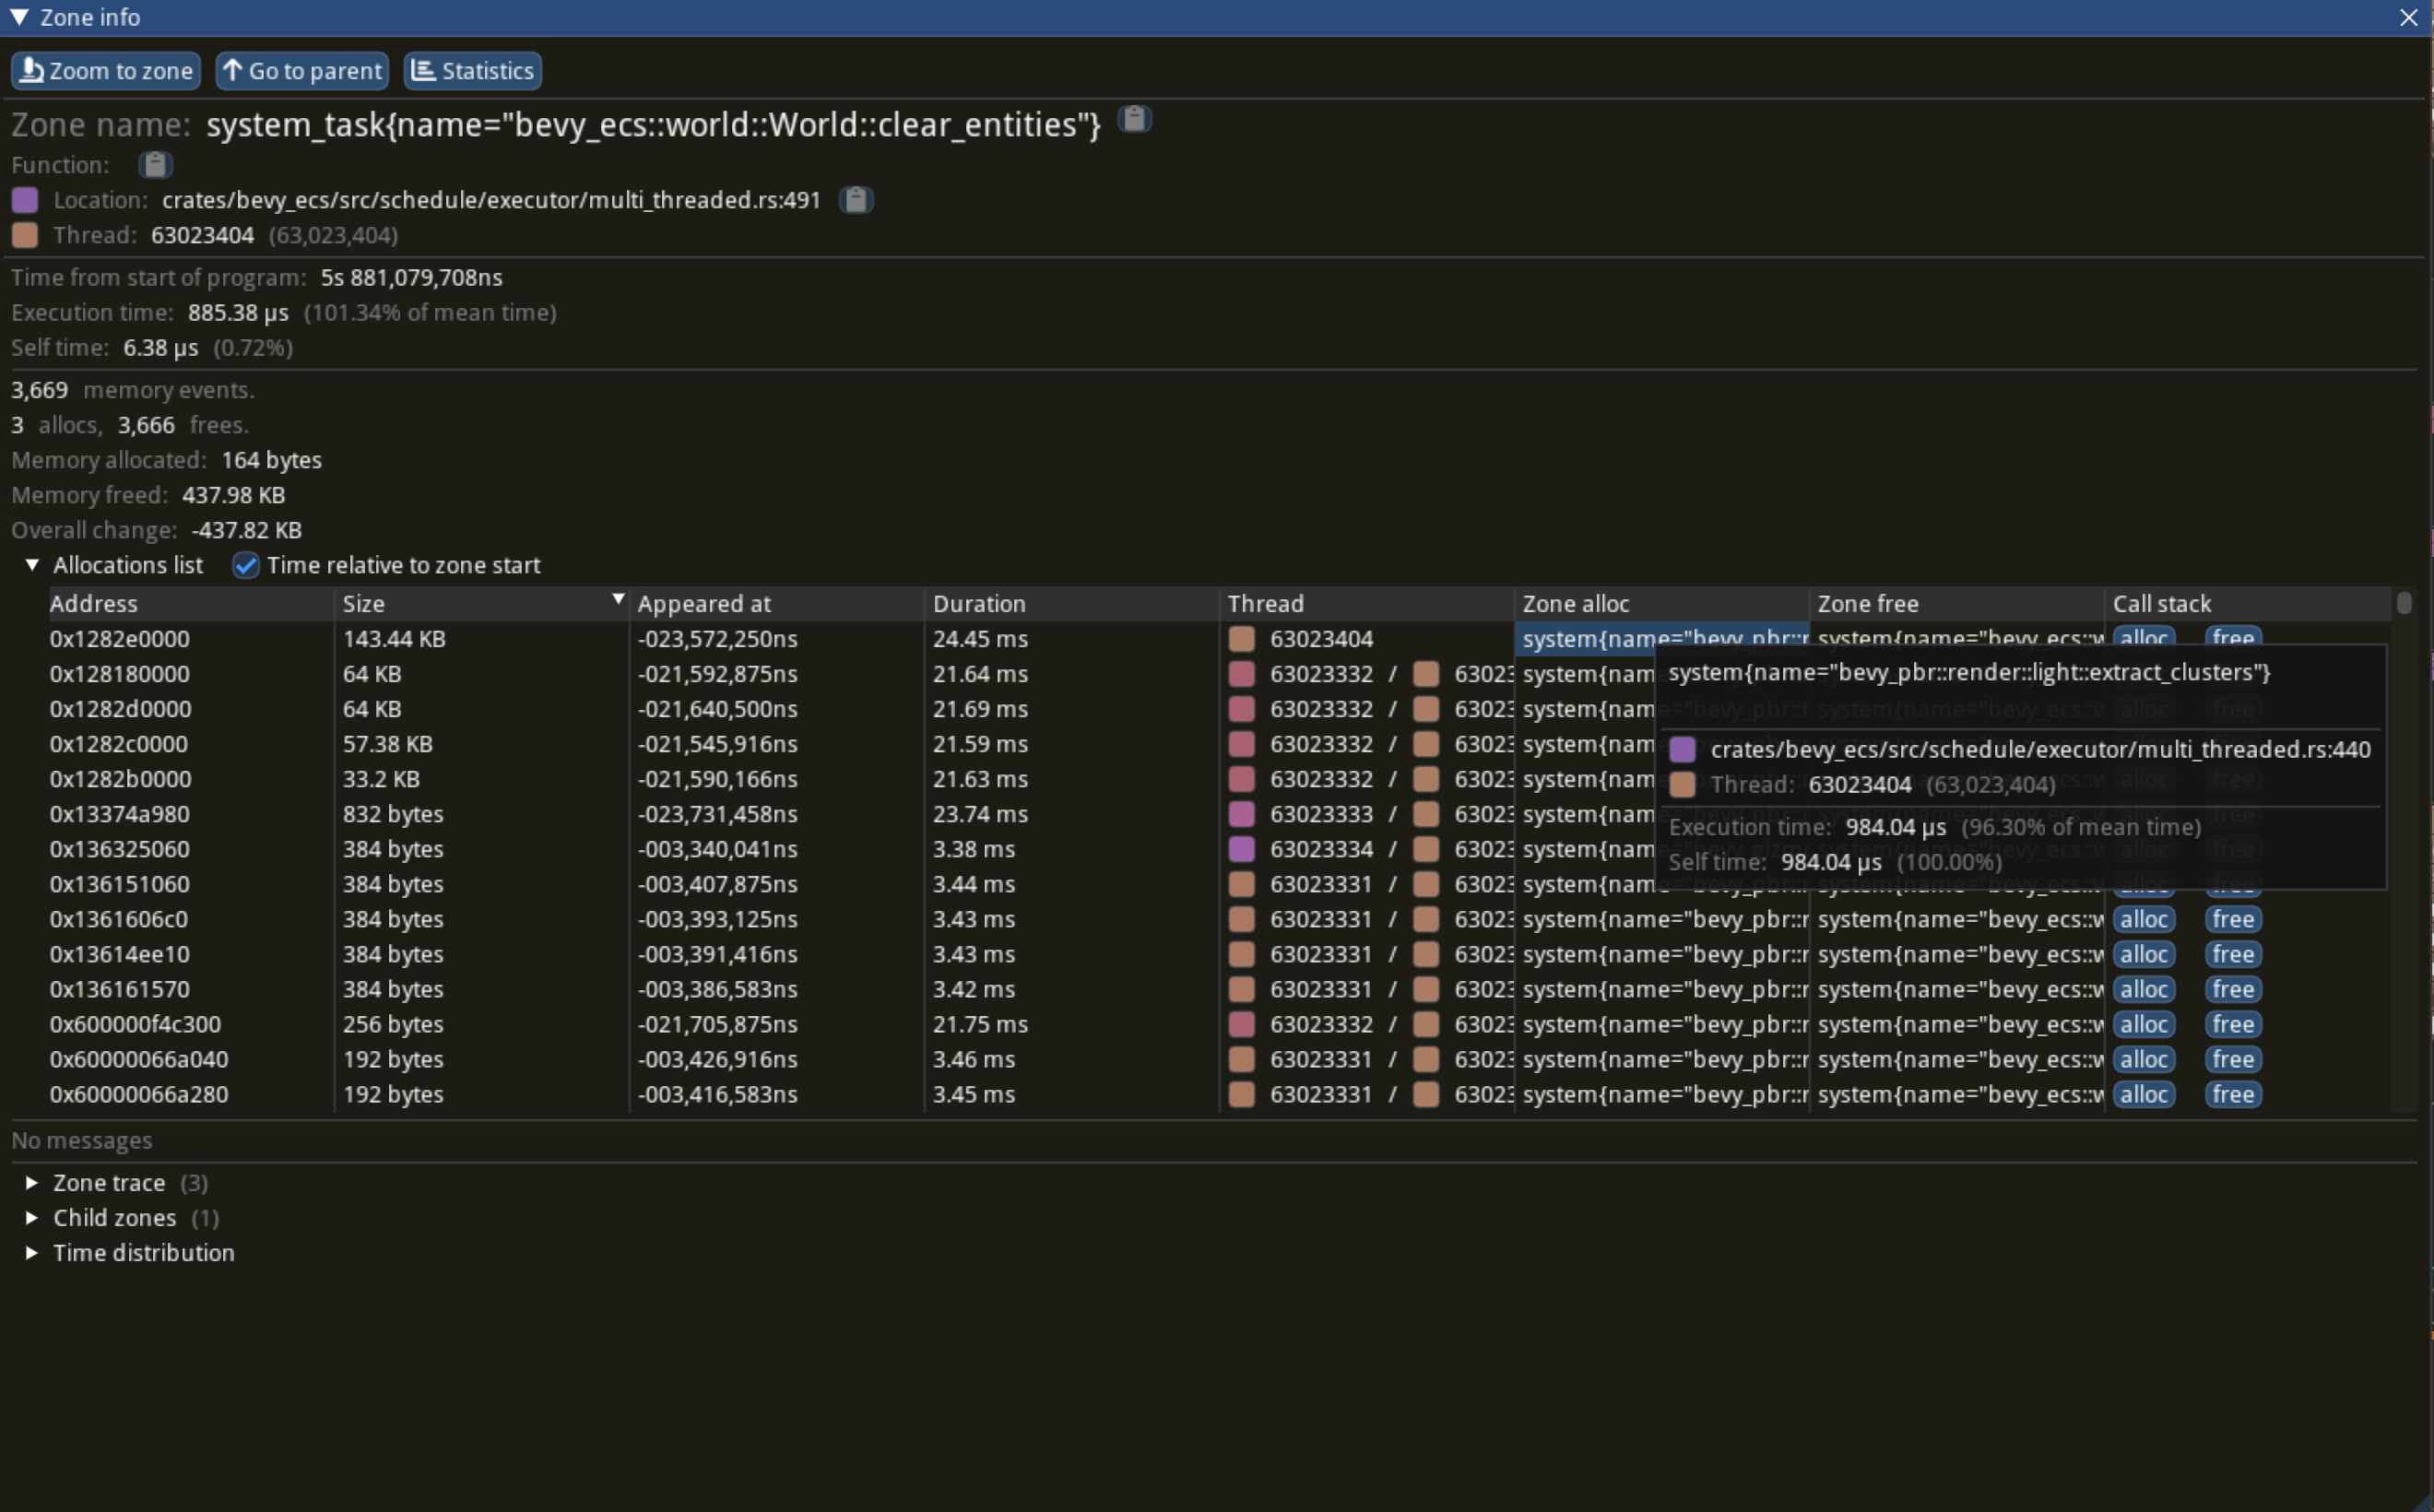
Another view showing all allocation events happening during a span, here clear_entities. We can see the span it was allocated in, and the size
Screenshot 2023-03-31 at 01 33 35

does this fix #6927?

At least a very good first step. @james7132 ?

@mockersf
Copy link
Member Author

mockersf commented Mar 30, 2023

I tried this a while back. For whatever reason, it broke logging due to registering a logger/subscriber before logging initialization in bevy_log happens. Not sure if that's a problem here.

Maybe that has been fixed now, at least logging doesn't seem broken for me.

@mockersf
Copy link
Member Author

and if you zoom on the graph, you can see each events, the span the allocation started, for how much, and the span it ended
Screenshot 2023-03-31 at 02 04 37

@james7132
Copy link
Member

At least a very good first step. @james7132 ?

Oh definitely, this is still great.. Though I would really like a Chrome-like support for labeled allocations to more readily dive into the exact split of memory usage at a given time.

Maybe that has been fixed now, at least logging doesn't seem broken for me.

Great. LGTM then.

@Elabajaba
Copy link
Contributor

On Linux I think there are probably better tools (bytehound for profiling and heaptrack for the visualization is excellent in my experience), but this will probably be the best we can do for Windows (existing Windows tools either don't work with Rust, or they don't give any real insight into the application's allocations other than the total amount allocated).

If anyone has an Intel CPU then it might be worth comparing this to VTune.

As a side note, I don't think we can use Tracy's GPU profiling unless someone can take over and finish nagisa/rust_tracy_client#41, then integrate it with wgpu-profiler (and then it would be limited to backends that support wgpu::Features::TIMESTAMP_QUERY).

@Davidster
Copy link

out of curiosity, did you see a huge slowdown from enabling the memory tracing? On my project I have to keep it off because it's too slow

@mockersf
Copy link
Member Author

out of curiosity, did you see a huge slowdown from enabling the memory tracing? On my project I have to keep it off because it's too slow

Yup!

The lighting example went from 500fps to 90

Copy link
Contributor

@hymm hymm left a comment

Choose a reason for hiding this comment

The reason will be displayed to describe this comment to others. Learn more.

Not going to block on it, but we should have something for how to use the feature in profiling.md.

@hymm hymm added the S-Ready-For-Final-Review This PR has been approved by the community. It's ready for a maintainer to consider merging it label Apr 15, 2023
@alice-i-cecile alice-i-cecile added this pull request to the merge queue Apr 17, 2023
Merged via the queue into bevyengine:main with commit 882c86e Apr 17, 2023
26 of 28 checks passed
Sign up for free to join this conversation on GitHub. Already have an account? Sign in to comment
Labels
A-Diagnostics Logging, crash handling, error reporting and performance analysis C-Performance A change motivated by improving speed, memory usage or compile times S-Ready-For-Final-Review This PR has been approved by the community. It's ready for a maintainer to consider merging it
Projects
None yet
Development

Successfully merging this pull request may close these issues.

None yet

6 participants