http://www.jhuapl.edu/pubgeo/pubgeo.html
http://www2.isprs.org/commissions/comm2/wg6/bench.html
http://homepages.inf.ed.ac.uk/rbf/CVonline/Imagedbase.htm#remote
review: A Review Of Benchmarking In Photogrammetry And Remote Sensing
-
Radiant MLHub https://www.mlhub.earth Open Library for Earth Observations Machine Learning. [github]
| Datasets | Images per class | Scene class | Total images | Spatial resolution(m) | Image sizes | Year |
|---|---|---|---|---|---|---|
| UC Merced Land Use | 100 | 21 | 2100 | 0.3 | 256×256 | 2010 |
| WHU-RS19 | ~50 | 19 | 1005 | up to 0.5 | 600×600 | 2010 |
| RSSCN7 | 400 | 7 | 2800 | - | 400×400 | 2015 |
| RSC11 | ~100 | 11 | 1232 | 0.2 | 512×512 | 2016 |
| SIRI-WHU | 200 | 12 | 2400 | 2 | 200×200 | 2016 |
| AID | 200~400 | 30 | 10000 | 0.5~0.8 | 600×600 | 2017 |
| EuroSAT | 2000 2500 3000 | 10 | 27000 | - | 64×64 | 2017 |
| NWPU-RESISC45 | 700 | 45 | 31500 | ~30 to 0.2 | 256×256 | 2017 |
| PatternNet | 800 | 38 | 30400 | 0.062~4.693 | 256×256 | 2017 |
| RSI-CB | RSI-CB128(~800) RSI-CB256(~690) |
RSI-CB128(45) RSI-CB256(35) |
RSI-CB128(36707) RSI-CB256(24747) |
0.3~3 | 128×128 256×256 |
2017 |
| RSD46-WHU | 500-3000 | 46 | 11,7000 | 0.5~2 | 2017 |
http://vision.ucmerced.edu/datasets/landuse.html
This is a 21 class land use image dataset meant for research purposes.
There are 100 images for each of the following classes:
agricultural,airplane,baseballdiamond,beach,buildings,chaparral,denseresidential,forest,freeway,golfcourse,harbor,intersection,mediumresidential,mobilehomepark,overpass,parkinglot,river,runway,sparseresidential,storagetanks,tenniscourt
Each image measures 256x256 pixels.
The images were manually extracted from large images from the USGS National Map Urban Area Imagery collection for various urban areas around the country. The pixel resolution of this public domain imagery is 1 foot.
Reference:
- Yi Yang and Shawn Newsam, "Bag-Of-Visual-Words and Spatial Extensions for Land-Use Classification," ACM SIGSPATIAL International Conference on Advances in Geographic Information Systems (ACM GIS), 2010.
http://captain.whu.edu.cn/repository.html
http://captain.whu.edu.cn/datasets/WHU-RS19.zip
WHU-RS19是从谷歌卫星影像上获取19类遥感影像,可用于场景分类和检索。
Reference:
- G.-S. Xia, W. Yang, J. Delon, Y. Gousseau. H. Maitre, H. Sun, "Structural high-resolution satellite image indexing". Symposium: 100 Years ISPRS - Advancing Remote Sensing Science: Vienna, Austria, 2010
https://sites.google.com/site/qinzoucn/documents
This dataset contains 2800 remote sensing images which are from 7 typical scene categories - the grass land, forest, farm land, parking lot, residential region, industrial region, and river&lake. For each category, there are 400 images collected from the Google Earth which are sampled on 4 different scales with 100 images per scale. Each image has a size of 400*400 pixels. This dataset is rather challenging due to the wide diversity of the scene images which are captured under changing seasons and varying weathers, and sampled with different scales.
Reference:
- Qin Zou, Lihao Ni, Tong Zhang and Qian Wang, Deep learning based feature selection for remote sensing scene classification, IEEE Geoscience and Remote Sensing Letters, vol. 12, no. 11, pp.2321-2325, 2015.
http://csc.lsu.edu/~saikat/deepsat/
https://arxiv.org/abs/1509.03602
Images were extracted from the National Agriculture Imagery Program (NAIP) dataset. The NAIP dataset consists of a total of 330,000 scenes spanning the whole of the Continental United States (CONUS). We used the uncompressed digital Ortho quarter quad tiles (DOQQs) which are GeoTIFF images and the area corresponds to the United States Geological Survey (USGS) topographic quadrangles. The average image tiles are ~6000 pixels in width and ~7000 pixels in height, measuring around 200 megabytes each. The entire NAIP dataset for CONUS is ~65 terabytes. The imagery is acquired at a 1-m ground sample distance (GSD) with a horizontal accuracy that lies within six meters of photo-identifiable ground control points. The images consist of 4 bands - red, green, blue and Near Infrared (NIR). In order to maintain the high variance inherent in the entire NAIP dataset, we sample image patches from a multitude of scenes (a total of 1500 image tiles) covering different landscapes like rural areas, urban areas, densely forested, mountainous terrain, small to large water bodies, agricultural areas, etc. covering the whole state of California. An image labeling tool developed as part of this study was used to manually label uniform image patches belonging to a particular landcover class. Once labeled, 28x28 non-overlapping sliding window blocks were extracted from the uniform image patch and saved to the dataset with the corresponding label. We chose 28x28 as the window size to maintain a significantly bigger context, and at the same time not to make it as big as to drop the relative statistical properties of the target class conditional distributions within the contextual window. Care was taken to avoid interclass overlaps within a selected and labeled image patch.
The datasets are encoded as MATLAB .mat files that can be read using the standard load command in MATLAB. Each sample image is 28x28 pixels and consists of 4 bands - red, green, blue and near infrared. The training and test labels are 1x4 and 1x6 vectors for SAT-4 and SAT-6 respectively having a single 1 indexing a particular class from 0 through 4 or 6 and 0 values at all other indices.
Reference:
- Saikat Basu, Sangram Ganguly, Supratik Mukhopadhyay, Robert Dibiano, Manohar Karki and Ramakrishna Nemani, DeepSat - A Learning framework for Satellite Imagery, ACM SIGSPATIAL 2015.
https://www.researchgate.net/publication/271647282_RS_C11_Database6
11 scenes, all using high resolution remote sensing images, downloaded from Google Earth
http://www.lmars.whu.edu.cn/prof_web/zhongyanfei/e-code.html
This is a 12-class Google image dataset of SIRI-WHU meant for research purposes.
There are 200 images for each of the following classes:
Agriculture, Commercial, Harbor, Idle land, Industrial, Meadow, Overpass, Park, Pond, Residential, River, Water
Each image measures 200*200 pixels, with a 2-m spatial resolution.
This dataset was acquired from Google Earth (Google Inc.) and mainly covers urban areas in China, and the scene image dataset is designed by RS_IDEA Group in Wuhan University (SIRI-WHU).
Reference:
- B. Zhao, Y. Zhong, G.-s. Xia, and L. Zhang, "Dirichlet-Derived Multiple Topic Scene Classification Model Fusing Heterogeneous Features for High Spatial Resolution Remote Sensing Imagery," IEEE Transactions on Geoscience and Remote Sensing, vol. 54, no. 4, pp. 2108-2123, Apr. 2016.
- B. Zhao, Y. Zhong, L. Zhang, and B. Huang, "The Fisher Kernel Coding Framework for High Spatial Resolution Scene Classification," Remote Sensing, vol. 8, no. 2, p. 157, doi:10.3390/rs8020157 2016.
- Q. Zhu, Y. Zhong, B. Zhao, G.-S. Xia, and L. Zhang, "Bag-of-Visual-Words Scene Classifier with Local and Global Features for High Spatial Resolution Remote Sensing Imagery," IEEE Geoscience and Remote Sensing Letters, DOI:10.1109/LGRS.2015.2513443 2016.
http://www.lmars.whu.edu.cn/xia/AID-project.html
https://captain-whu.github.io/AID
Reference:
- G.-S. Xia, J. Hu, F. Hu, B. Shi, X. Bai, Y. Zhong, L. Zhang, X. Lu, “AID: A benchmark dataset for performance evaluation of aerial scene classification”, IEEE Transactions on Geoscience and Remote Sensing, vol. 55, no. 7, pp. 3965-3981, 2017.
http://www.escience.cn/people/JunweiHan/NWPU-RESISC45.html
https://arxiv.org/abs/1703.00121
NWPU-RESISC45 dataset is a publicly available benchmark for REmote Sensing Image Scene Classification (RESISC), created by Northwestern Polytechnical University (NWPU). This dataset contains 31,500 images, covering 45 scene classes with 700 images in each class. These 45 scene classes include airplane, airport, baseball diamond, basketball court, beach, bridge, chaparral, church, circular farmland, cloud, commercial area, dense residential, desert, forest, freeway, golf course, ground track field, harbor, industrial area, intersection, island, lake, meadow, medium residential, mobile home park, mountain, overpass, palace, parking lot, railway, railway station, rectangular farmland, river, roundabout, runway, seaice, ship, snowberg, sparse residential, stadium, storage tank, tennis court, terrace, thermal power station, and wetland.
Reference:
- G. Cheng, J. Han, X. Lu. Remote Sensing Image Scene Classification: Benchmark and State of the Art. Proceedings of the IEEE.
https://sites.google.com/view/zhouwx/dataset
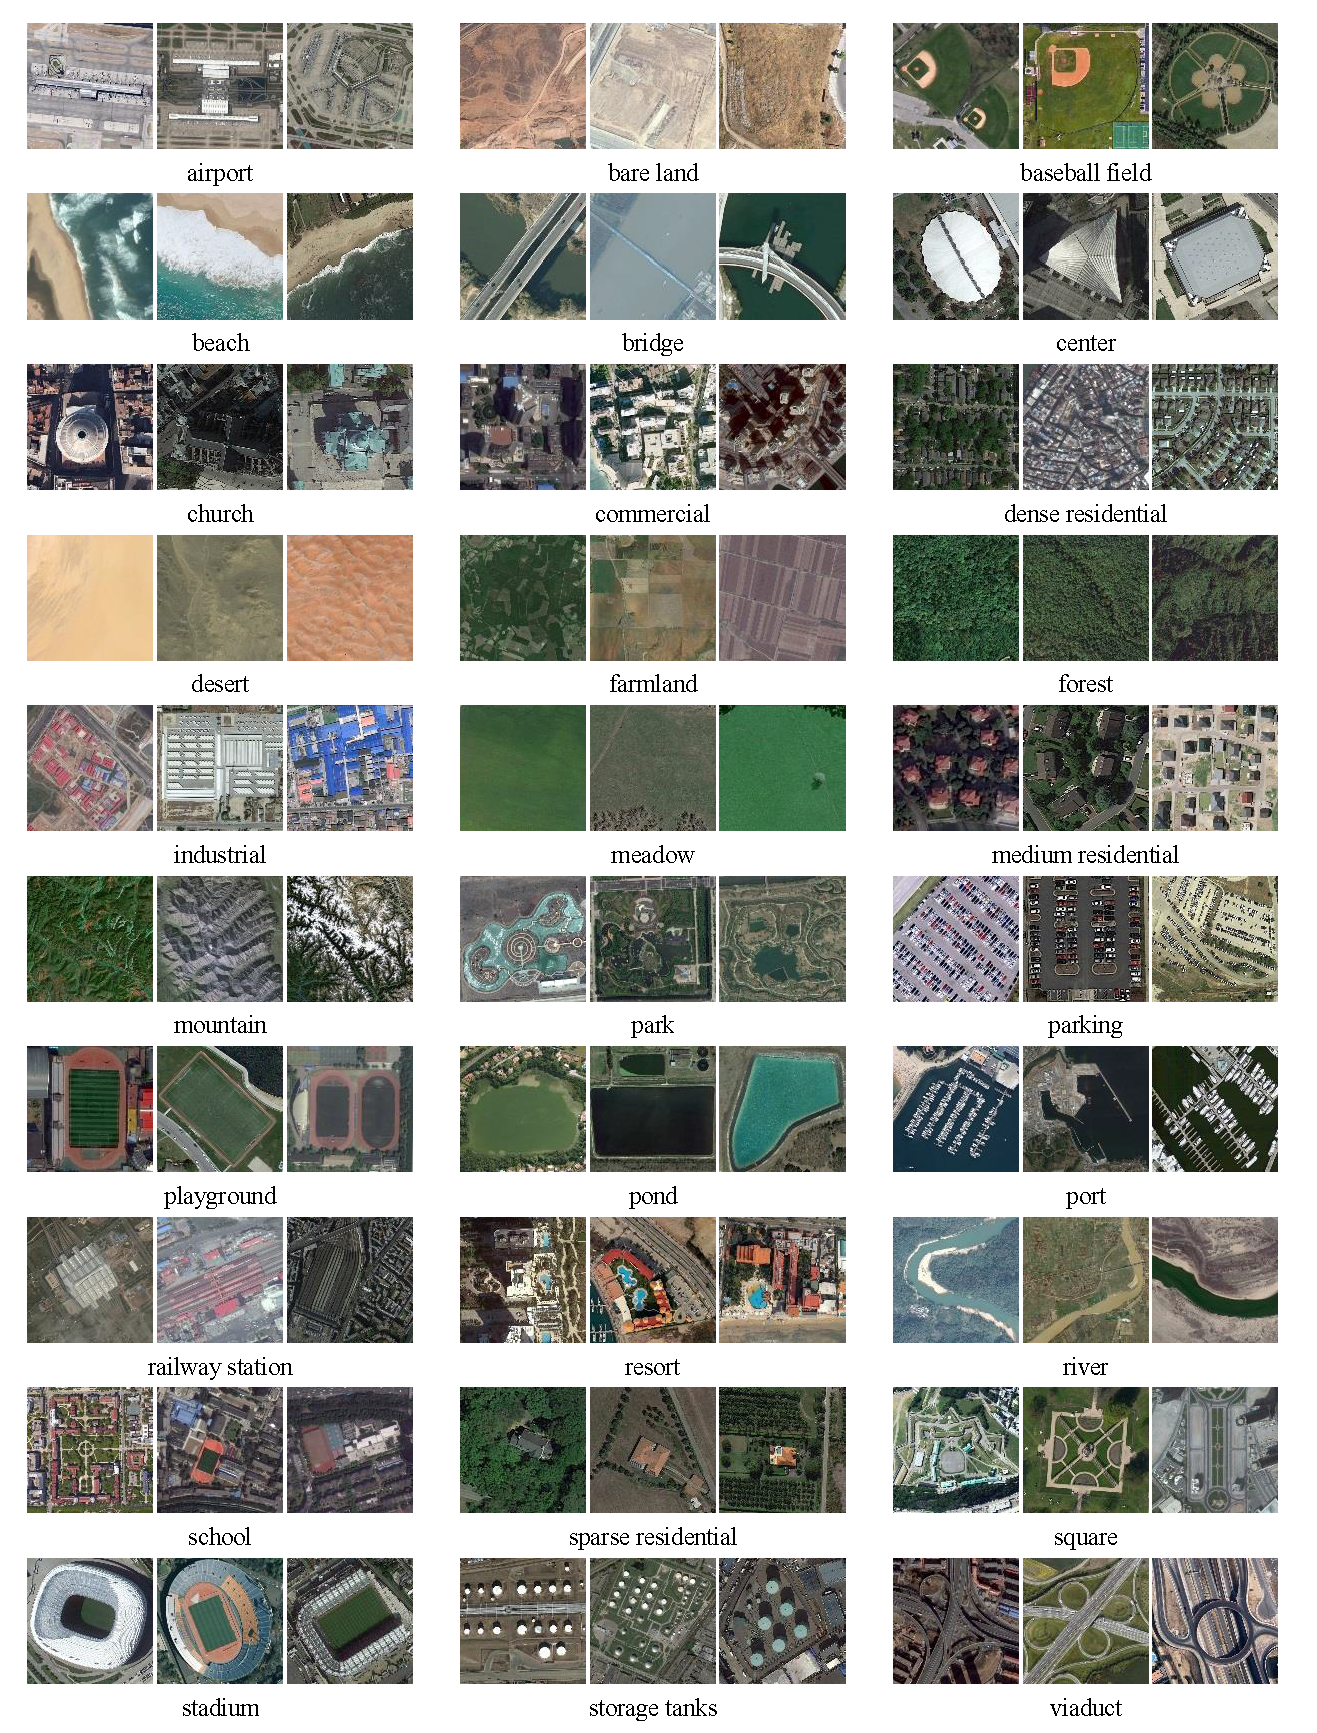
PatternNet is a large-scale high-resolution remote sensing dataset collected for remote sensing image retrieval. There are 38 classes and each class has 800 images of size 256×256 pixels. The images in PatternNet are collected from Google Earth imagery or via the Google Map API for some US cities. The figure shows some example images from each class.
Reference:

- Zhou, W., Newsam, S., Li, C., & Shao, Z. (2017). PatternNet: A Benchmark Dataset for Performance Evaluation of Remote Sensing Image Retrieval. arXiv preprint arXiv:1706.03424.
- Zhou, W., Newsam, S., Li, C., & Shao, Z. (2017). Learning Low Dimensional Convolutional Neural Networks for High-Resolution Remote Sensing Image Retrieval. Remote Sensing, 9(5), 489.
- Zhou, W., Shao, Z., Diao, C., & Cheng, Q. (2015). High-resolution remote-sensing imagery retrieval using sparse features by auto-encoder. Remote Sensing Letters, 6(10), 775-783.
https://arxiv.org/abs/1705.10450
https://github.com/lehaifeng/RSI-CB

Considering the different image size requirements of the DCNN, construct two datasets of 256 × 256 and 128 × 128 pixel sizes (RSI-CB256 and RSI-CB128, respectively) with 0.3–3-m spatial resolutions. The former contains 35 categories and more than 24,000 images. The latter contains 45 categories and more than 36,000 images. We establish a strict object category system according to the national standard of land-use classification in China and the hierarchical grading mechanism of ImageNet. The six categories are agricultural land, construction land and facilities, transportation and facilities, water and water conservancy facilities, woodland, and other land.
Reference:
- Li H, Tao C, Wu Z, et al. RSI-CB: a large scale remote sensing image classification benchmark via crowdsource data[J]. arXiv preprint arXiv:1705.10450, 2017.
https://arxiv.org/abs/1806.00801
Reference:
- Jin P, Xia G S, Hu F, et al. AID++: An Updated Version of AID on Scene Classification[C]//IGARSS 2018-2018 IEEE International Geoscience and Remote Sensing Symposium. IEEE, 2018: 4721-4724.
http://www.lmars.whu.edu.cn/prof_web/xiaozhifeng/dataset.html
RSD46-WHU is a larget-scale open dataset for scene classification in remote sensing images. The dataset is collected from Google Earth and Tianditu. The ground resolution of most classes is 0.5m, and the others are about 2m. There are 500-3000 images in each class. The RSD46-WHU dataset has a number of 11,7000 images with 46 classes.
Reference:
- Y. Long, Y. Gong, Z. Xiao and Q. Liu, "Accurate Object Localization in Remote Sensing Images Based on Convolutional Neural Networks," in IEEE Transactions on Geoscience and Remote Sensing, vol. 55, no. 5, pp. 2486-2498, May 2017. doi: 10.1109/TGRS.2016.2645610
- High-Resolution Remote Sensing Image Retrieval Based on CNNs from a Dimensional Perspective, Zhifeng Xiao, Yang Long, Deren Li, Chunshan Wei, Gefu Tang, Junyi Liu. Remote Sensing, 9(7), 2017.
https://arxiv.org/abs/1902.06148
http://bigearth.net/
The BigEarthNet is a new large-scale Sentinel-2 benchmark archive, consisting of 590,326 Sentinel-2 image patches. To construct the BigEarthNet, 125 Sentinel-2 tiles acquired between June 2017 and May 2018 over the 10 countries (Austria, Belgium, Finland, Ireland, Kosovo, Lithuania, Luxembourg, Portugal, Serbia, Switzerland) of Europe were initially selected. All the tiles were atmospherically corrected by the Sentinel-2 Level 2A product generation and formatting tool (sen2cor). Then, they were divided into 590,326 non-overlapping image patches. Each image patch was annotated by the multiple land-cover classes (i.e., multi-labels) that were provided from the CORINE Land Cover database of the year 2018 (CLC 2018).
Reference:
- G. Sumbul, M. Charfuelan, B. Demir, V. Markl, BigEarthNet: A large-scale benchmark archive for remote sensing image understanding, arXiv preprint, 2019.
| Dataset | # Class | # Images | # Image width | # Instances | Annotation way |
|---|---|---|---|---|---|
| RSOD | 4 | 976 | 6950 | horizontal BB | |
| NWPU VHR-10 | 10 | 800 | ~1000 | 3651 | horizontal BB |
| VEDAI | 3 | 1268 | 512,1024 | 2950 | oriented BB |
| COWC | 1 | 53 | 2000~19,000 | 32716 | one dot |
| HRSC2016 | 1 | 1061 | ~1100 | 2976 | oriented BB |
| DOTA | 15 | 2806 | 800~4000 | 118,282 | oriented BB |
| xView | 60 | 1128 | ~1,000,000 | horizontal BB | |
| DIOR | 20 | 23463 | 800 | 190,288 | horizontal BB |
https://github.com/RSIA-LIESMARS-WHU/RSOD-Dataset-
It is an open dataset for object detection in remote sensing images. The dataset includes aircraft, oiltank, playground and overpass.
The format of this dataset that for PASCAL VOC.
The datase includes 4 files, and each file is for one kind of object. Please download the dataset files from BaiduYun.
- aircraft dataset, 4993 aircrafts in 446 images.
- playground, 191 playgrounds in 189 images.
- overpass, 180 overpass in 176 overpass.
- oiltank, 1586 oiltanks in 165 images.
Reference:
- Y. Long, Y. Gong, Z. Xiao and Q. Liu, "Accurate Object Localization in Remote Sensing Images Based on Convolutional Neural Networks," in IEEE Transactions on Geoscience and Remote Sensing, vol. 55, no. 5, pp. 2486-2498, May 2017. doi: 10.1109/TGRS.2016.2645610, link
- Z Xiao, Q Liu, G Tang, X Zhai, "Elliptic Fourier transformation-based histograms of oriented gradients for rotationally invariant object detection in remote-sensing images", International Journal of Remote Sensing, vol. 36, no. 2, 2015
NWPU VHR-10 dataset is a publicly available 10-class geospatial object detection dataset used for research purposes only.These ten classes of objects are airplane, ship, storage tank, baseballdiamond, tennis court, basketball court, ground track field, harbor, bridge,and vehicle. This dataset contains totally 800 very-high-resolution (VHR)remote sensing images that were cropped from Google Earth and Vaihingen dataset and then manually annotated by experts.
Thisdataset can be downloaded from OneDrive or BaiduWangpan.
Reference:
- G. Cheng, J. Han, P. Zhou, L. Guo. Multi-class geospatial object detection and geographic imageclassification based on collection of part detectors. ISPRS Journal ofPhotogrammetry and Remote Sensing, 98: 119-132, 2014.
- G. Cheng, J. Han. A survey on objectdetection in optical remote sensing images. ISPRS Journal of Photogrammetry andRemote Sensing, 117: 11-28, 2016.
- G. Cheng, P. Zhou, J. Han. Learningrotation-invariant convolutional neural networks for object detection in VHRoptical remote sensing images. IEEE Transactions on Geoscience and RemoteSensing, 54(12): 7405-7415, 2016.
https://downloads.greyc.fr/vedai/
VEDAI is a dataset for Vehicle Detection in Aerial Imagery, provided as a tool to benchmark automatic target recognition algorithms in unconstrained environments. The vehicles contained in the database, in addition of being small, exhibit different variabilities such as multiple orientations, lighting/shadowing changes, specularities or occlusions. Furthermore, each image is available in several spectral bands and resolutions. A precise experimental protocol is also given, ensuring that the experimental results obtained by different people can be properly reproduced and compared. We also give the performance of some baseline algorithms on this dataset, for different settings of these algorithms, to illustrate the difficulties of the task and provide baseline comparisons.
Reference:
- Vehicle Detection in Aerial Imagery: A small target detection benchmark., Sébastien Razakarivony and Frédéric Jurie, Journal of Visual Communication and Image Representation, 2015
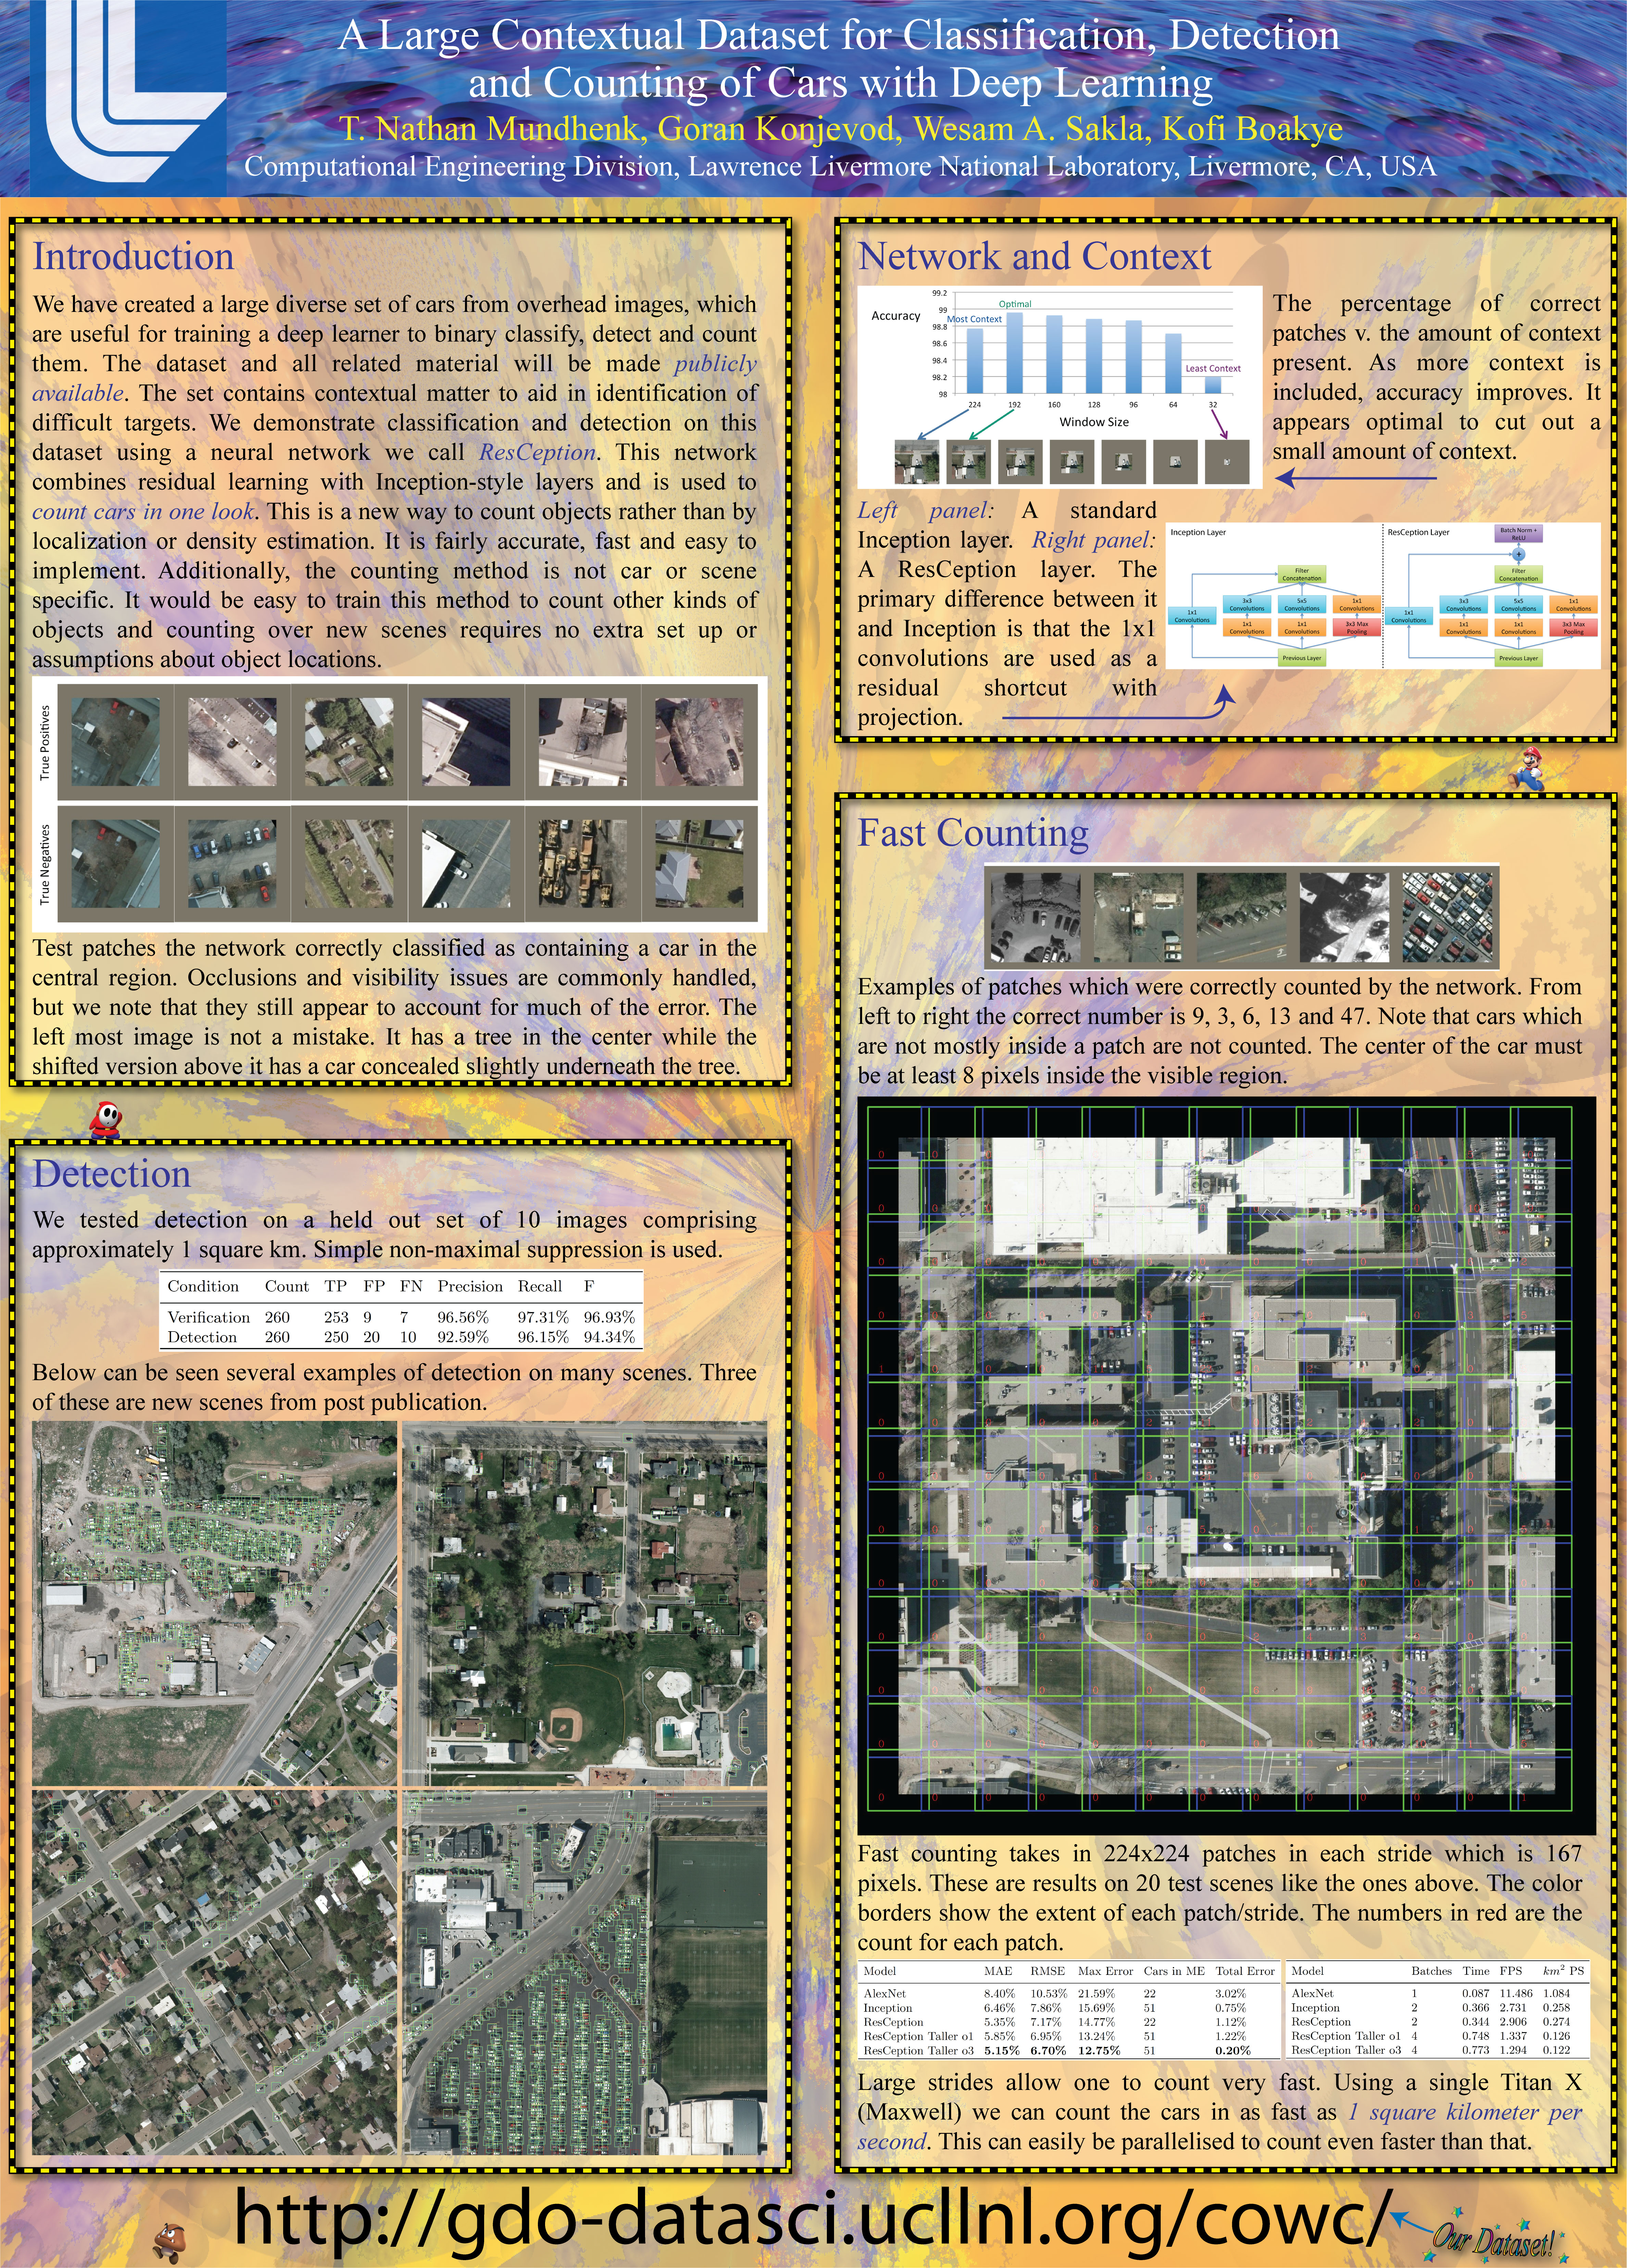
https://gdo152.llnl.gov/cowc/
Poster Paper
Github: https://github.com/LLNL/cowc
FTP: ftp://gdo152.ucllnl.org/cowc/
The Cars Overhead With Context (COWC) data set is a large set of annotated cars from overhead. It is useful for training a device such as a deep neural network to learn to detect and/or count cars.
The dataset has the following attributes:
- (1) Data from overhead at 15 cm per pixel resolution at ground (all data is EO).
- (2) Data from six distinct locations: Toronto Canada, Selwyn New Zealand, Potsdam and Vaihingen Germany, Columbus and Utah United States.
- (3) 32,716 unique annotated cars. 58,247 unique negative examples.
- (4) Intentional selection of hard negative examples.
- (5) Established baseline for detection and counting tasks.
- (6) Extra testing scenes for use after validation.
Reference:
- Mundhenk T N, Konjevod G, Sakla W A, et al. A large contextual dataset for classification, detection and counting of cars with deep learning[C]//European Conference on Computer Vision. Springer, Cham, 2016: 785-800.
DOTA Dataset Page:
https://captain-whu.github.io/DOTA/index.html
http://captain.whu.edu.cn/DOTAweb/
https://captain-whu.github.io/ODAI/
https://arxiv.org/abs/1711.10398

Reference:
- Xia G S, Bai X, Ding J, et al. DOTA: A Large-scale Dataset for Object Detection in Aerial Images[J]. arXiv preprint arXiv:1711.10398, 2017.
- Gui-Song Xia, Xiang Bai, Jian Ding, Zhen Zhu, Serge Belongie, Jiebo Luo, Mihai Datcu, Marcello Pelillo, Liangpei Zhang; The IEEE Conference on Computer Vision and Pattern Recognition (CVPR), 2018, pp. 3974-3983
https://eostore.itc.utwente.nl:5001/fsdownload/zZYfgbB2X/ITCVD
The images were taken from an airplane platform which flied over Enschede, The Netherlands, in the height of ca 330m above the ground (Slagboom en Peeters, 2017). The images are taken in both nadir view and oblique view. The tilt angle of oblique view is 45 degrees. The Ground Sampling Distance (GSD) of the nadir images is 10cm. 135 images with 23543 vehicles are used for training and the remaining 38 images with 5545 vehicles for testing. Each vehicle in the dataset is manually annotated using a bounding box which is denoted as (x,y,w,h), where (x,y) is the coordinate of the left-up corner of the box, and (w,h) is the width and height of the box respectively.
Reference:
- Yang M Y, Liao W, Li X, et al. Deep Learning for Vehicle Detection in Aerial Images[C]//2018 25th IEEE International Conference on Image Processing (ICIP). IEEE, 2018: 3079-3083.
- Yang M Y, Liao W, Li X, et al. Vehicle Detection in Aerial Images[J]. arXiv preprint arXiv:1801.07339, 2018.
http://xviewdataset.org/
http://challenge.xviewdataset.org
https://arxiv.org/abs/1802.07856

xView is one of the largest publicly available sets of overhead imagery. It contains images from complex scenes around the world, annotated with more than one million bounding boxes representing a diverse range of 60 object classes. Compared to other overhead imagery datasets, xView images are high-resolution, multi-spectral, and labeled with a greater variety of objects.
Given a high-resolution satellite image, the Challenge task is to predict a bounding box for each object in the image. The DIUx xView Challenge is focused on accelerating progress in four computer vision frontiers: Reduce minimum resolution for detection; Improve learning efficiency; Enable discovery of more object classes; Improve detection of fine-grained classes.
The DIUx xView Challenge follows in the footsteps of Challenges such as Common Objects in Context (COCO) and seeks to build off SpaceNet and Functional Map of the World (FMoW) to apply computer vision to the growing amount of available imagery from space so that we can understand the visual world in new ways and address a range of important applications.
Reference:
- Lam D, Kuzma R, McGee K, et al. xView: Objects in Context in Overhead Imagery[J]. arXiv preprint arXiv:1802.07856, 2018.
https://captain-whu.github.io/DOAI2019/index.html
- Task1 - Detection with oriented bounding boxes
- Task2 - Detection with horizontal bounding boxes
- Task3 - Jointly object detection and orientation estimation for movable instances
Dataset: DOTA-v1.5 contains 0.4 million annotated object instances within 19 categories, which is an updated version of DOTA-v1.0. Both of them use the same aerial images but DOTA-v1.5 has revised and updated the annotation of objects, where many small object instances about or below 10 pixels that were missed in DOTA-v1.0 have been additionally annotated. The categories of DOTA-v1.5 is also extended. Concretely, the categories of container crane, tractor are added. The large vehicle is split into bus and truck. The ship is split into large ship and small ship.In consistent with DOTA-v.1.0, the images in DOTA-v1.5 are mainly collected from the Google Earth, satellite JL-1, and satellite GF-2 of the China Centre for Resources Satellite Data and Application.The object categories in DOTA-v1.5 include: plane, large ship, small ship, storage tank, baseball diamond, tennis court, basketball court, ground track field, harbor, bridge, bus, truck, small vehicle, helicopter, roundabout, soccer ball field, basketball court, container crane and tractor.
http://www.escience.cn/people/gongcheng/DIOR.html
Reference:
- Object Detection in Optical Remote Sensing Images: A Survey and A New Benchmark[J]. arXiv preprint arXiv:1909.00133, 2019.
https://www.cosmiqworks.org/current-projects/rareplanes/
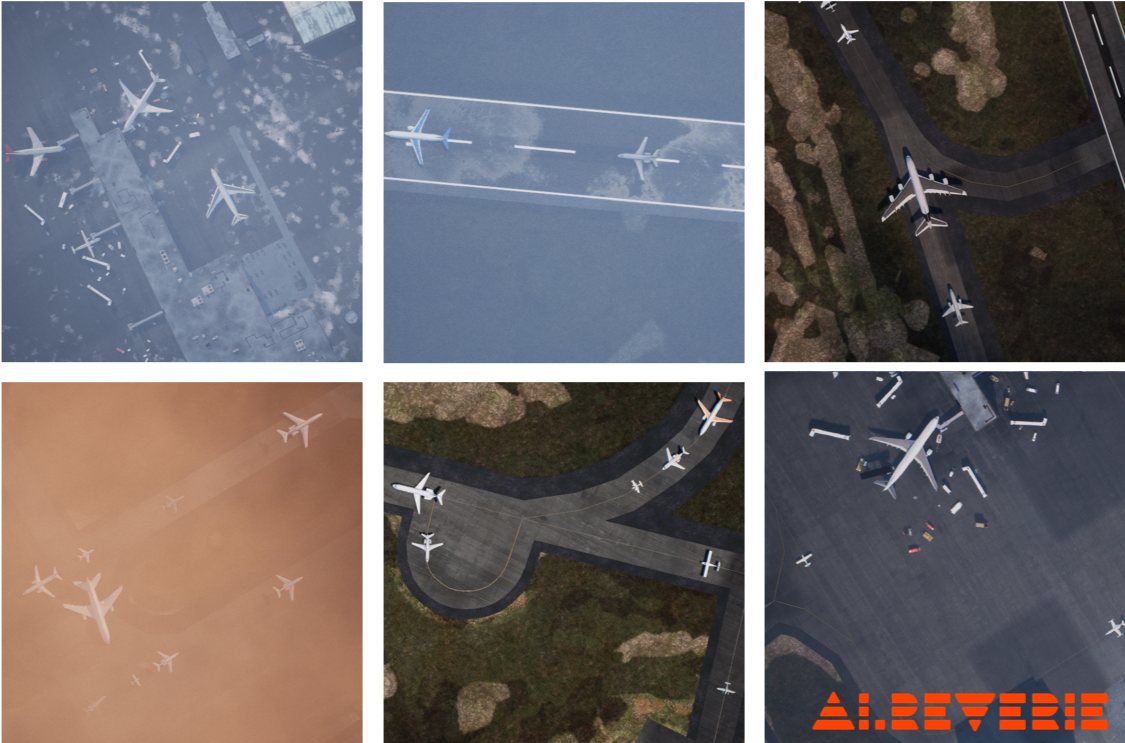
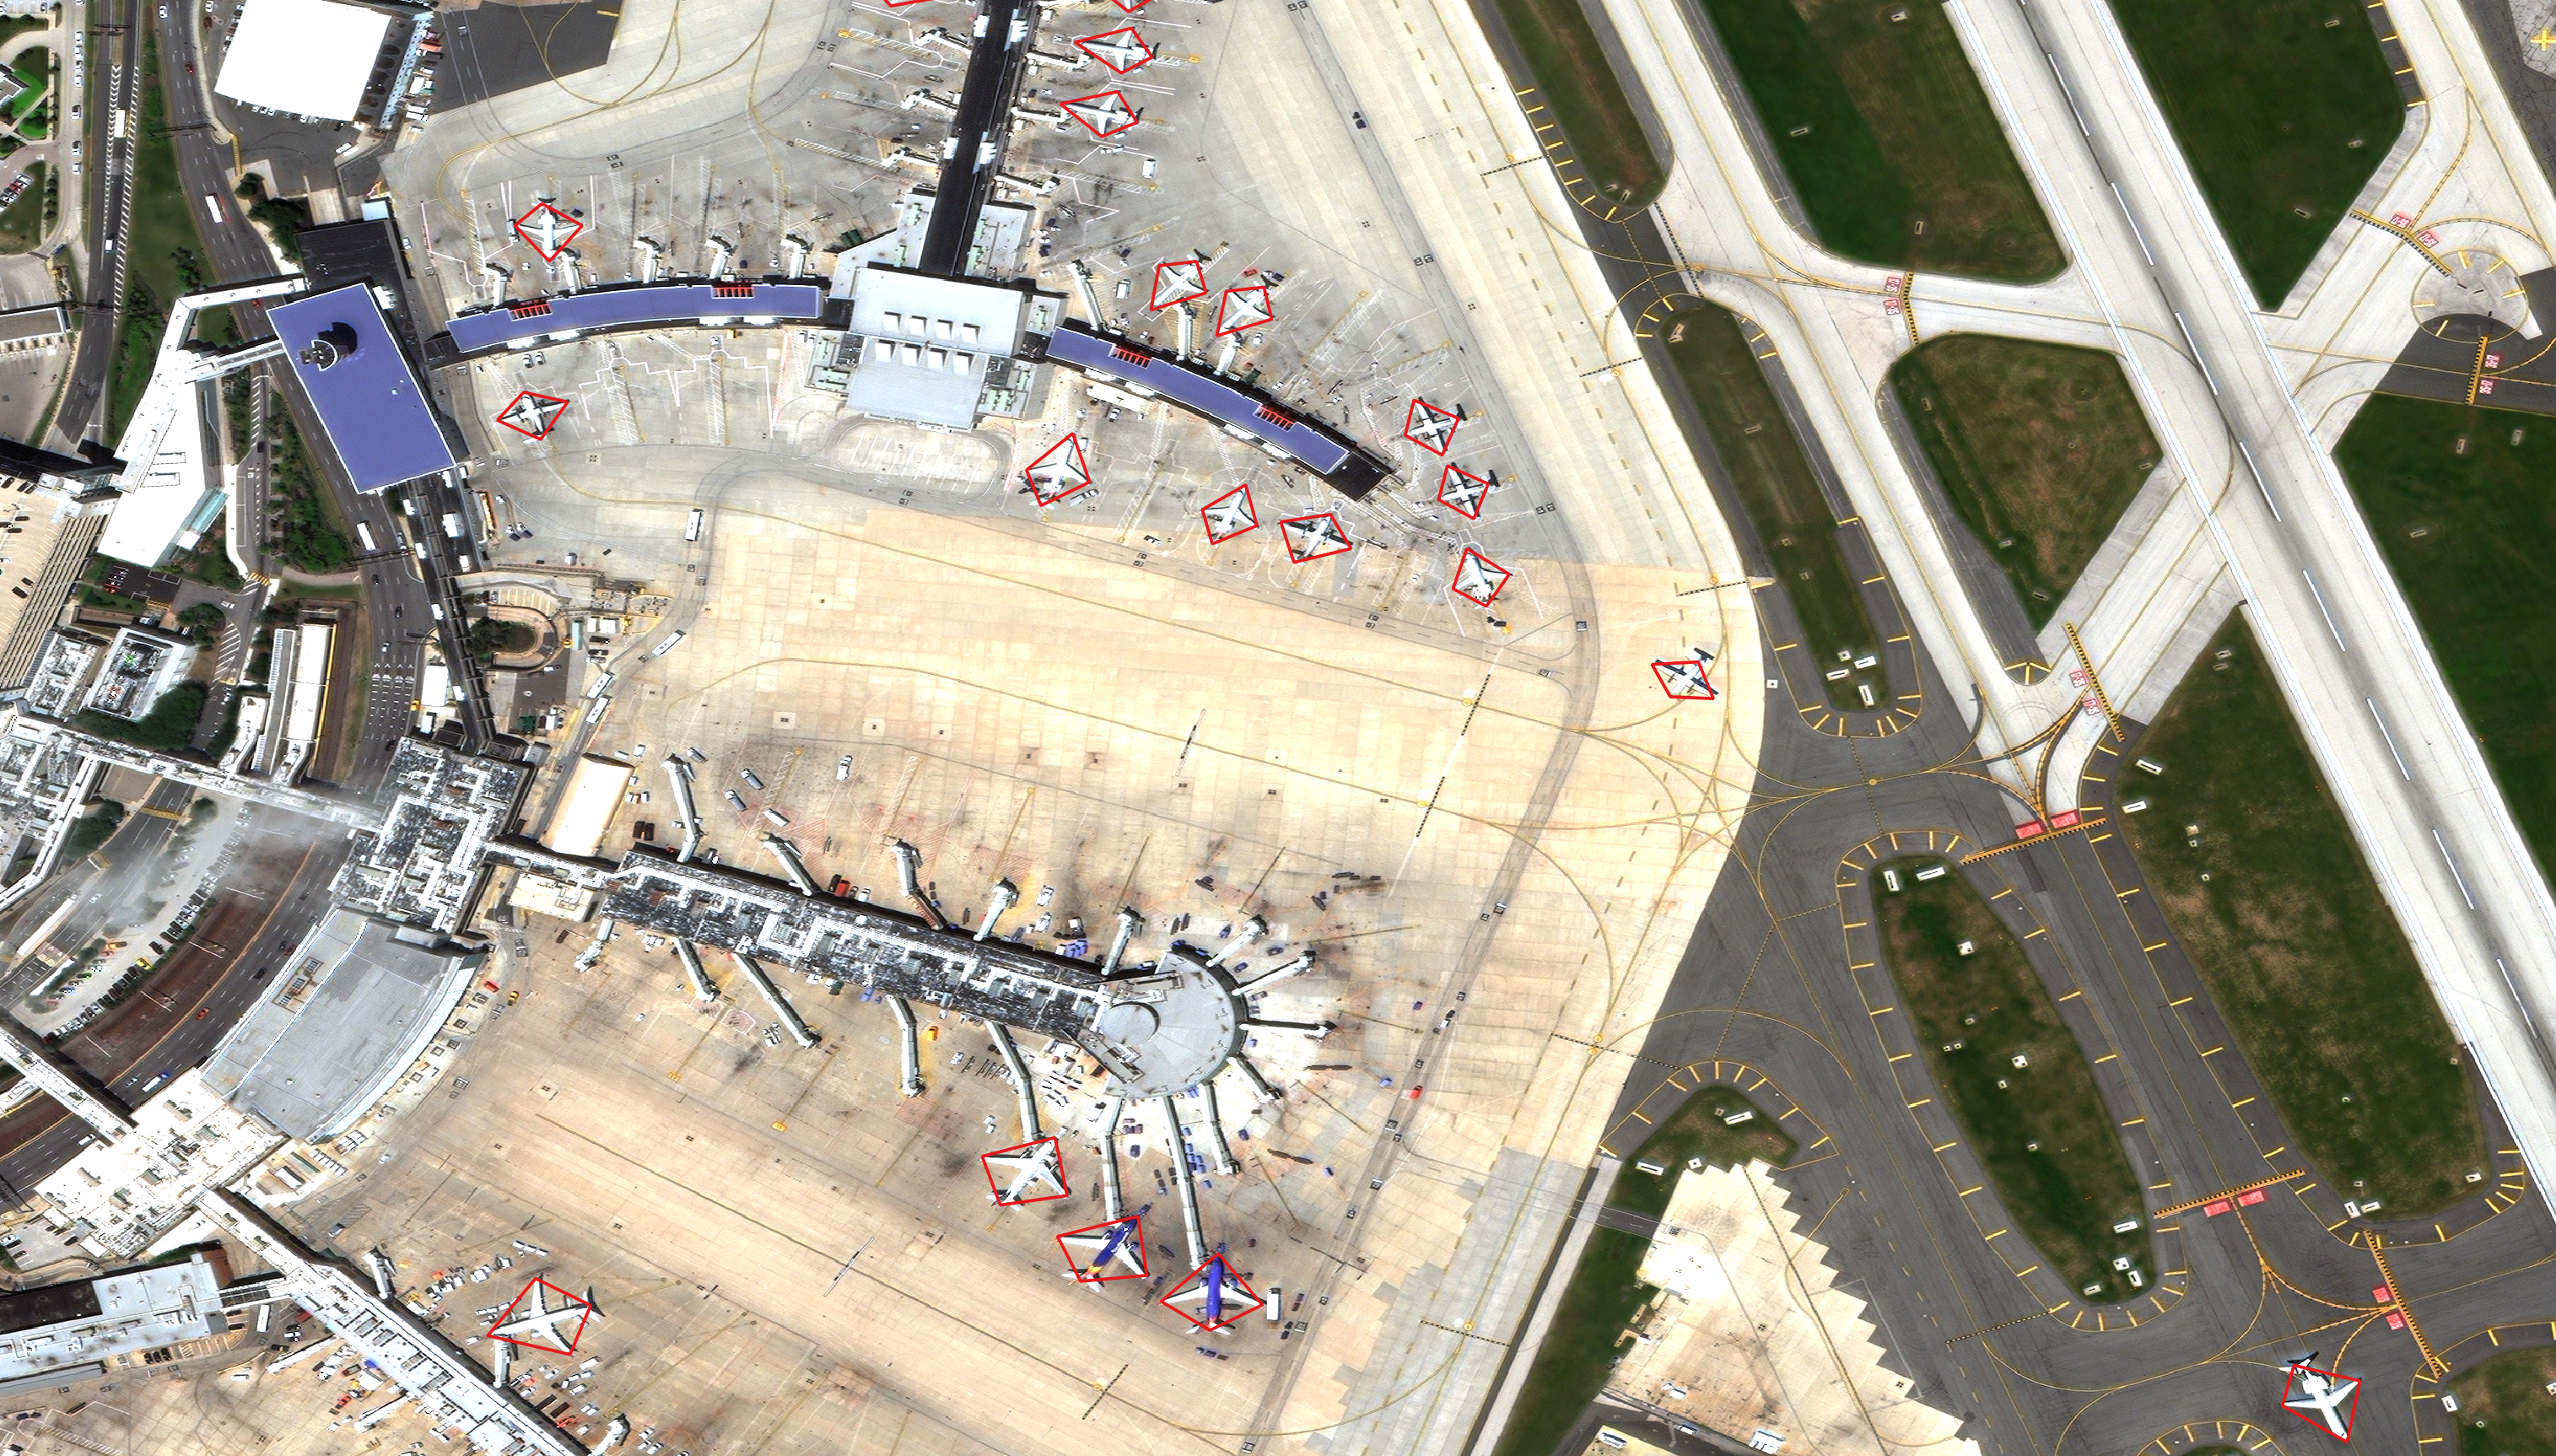
RarePlanes examines the difference between simulated and synthetic data of computer vision algorithms to detect and classify types of aircraft models in satellite imagery.
RarePlanes is both a machine learning dataset and research study that examines the value of synthetic data to aid computer vision algorithms in their ability to automatically detect aircraft and their attributes in satellite imagery. CosmiQ curated a dataset of ~600 WorldView-3 satellite images spanning over 200 locations in 31 countries. It includes ~30,000 manually annotated aircraft and 9 fine grain attributes including: aircraft length, wingspan, wing-shape, wing-position, propulsion, number of engines, number of tail-fins, and aircrafts role. The accompanying synthetic dataset is generated via IQT portfolio company AI.Reverie’s simulation platform and features over 46,000 simulated satellite images with ~300,000 airplane annotations.
The experiments in RarePlanes will address three key areas:
- The performance tradeoffs of computer vision algorithms for detection and classification of aircraft type / model using blends of synthetic and real training data.
- The performance tradeoffs of computer vision algorithms for identification of rare aircraft that are infrequently observed in satellite imagery using blends of synthetic and real training data.
- The value of weakly supervised annotations for detection unique aircraft attributes.
https://sites.google.com/site/michelevolpiresearch/data/zurich-dataset


The "Zurich Summer v1.0" dataset is a collection of 20 chips (crops), taken from a QuickBird acquisition of the city of Zurich (Switzerland) in August 2002. QuickBird images are composed by 4 channels (NIR-R-G-B) and were pansharpened to the PAN resolution of about 0.62 cm GSD. We manually annotated 8 different urban and periurban classes : Roads, Buildings, Trees, Grass, Bare Soil, Water, Railways and Swimming pools. The cumulative number of class samples is highly unbalanced, to reflect real world situations. Note that annotations are not perfect, are not ultradense (not every pixel is annotated) and there might be some errors as well. We performed annotations by jointly selecting superpixels (SLIC) and drawing (freehand) over regions which we could confidently assign an object class.
Reference:
- Volpi, M. & Ferrari, V.; Semantic segmentation of urban scenes by learning local class interactions, In IEEE CVPR 2015 Workshop "Looking from above: when Earth observation meets vision" (EARTHVISION), Boston, USA, 2015.
- Volpi, M. & Ferrari, V.; Structured prediction for urban scene semantic segmentation with geographic context, In Joint Urban Remote Sensing Event JURSE 2015, Lausanne, Switzerland, 2015.
4.2. ISPRS Test Project on Urban Classification and 3D Building Reconstruction--2D Semantic Labeling Contest
http://www2.isprs.org/commissions/comm3/wg4/semantic-labeling.html


To this end we provide two state-of-the-art airborne image datasets, consisting of very high resolution true ortho photo (TOP) tiles and corresponding digital surface models (DSMs) derived from dense image matching techniques. Both areas cover urban scenes. While Vaihingen is a relatively small village with many detached buildings and small multi story buildings, Potsdam shows a typical historic city with large building blocks, narrow streets and dense settlement structure.
Each dataset has been classified manually into six most common land cover classes. We provide the classification data (label images) for approximately half of the images, while the ground truth of the remaining scenes will remain unreleased and stays with the benchmark test organizers to be used for evaluation of submitted results. Participants shall use all data with ground truth for training or internal evaluation of their method.
Six categories/classes have been defined:
- Impervious surfaces (RGB: 255, 255, 255)
- Building (RGB: 0, 0, 255)
- Low vegetation (RGB: 0, 255, 255)
- Tree (RGB: 0, 255, 0)
- Car (RGB: 255, 255, 0)
- Clutter/background (RGB: 255, 0, 0)
The clutter/background class includes water bodies (present in two images with part of a river) and other objects that look very different from everything else (e.g., containers, tennis courts, swimming pools) and that are usually not of interest in semantic object classification in urban scenes, however note that participants must submit labels for all classes (including the clutter/background class). For instance, it is not possible to submit only classification results for the category building.
http://www.grss-ieee.org/2017-ieee-grss-data-fusion-contest/
http://dase.ticinumaerospace.com/index.php
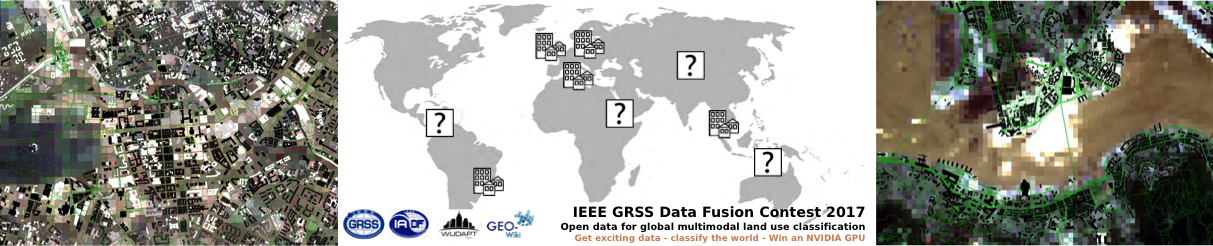
Local climate zones are a generic, climate-based typology of urban and natural landscapes, which delivers information on basic physical properties of an area that can be used by land use planners or climate modelers. LCZ are used as first order discretization of urban areas by the World Urban Database and Access Portal Tools initiative, which aims to collect, store and disseminate data on the form and function of cities around the world.

10 urban LCZs corresponding to various built types:
- Compact high-rise (class code in the ground truth: 1);
- Compact midrise (class code in the ground truth: 2);
- Compact low-rise (class code in the ground truth: 3);
- Open high-rise (class code in the ground truth: 4);
- Open midrise (class code in the ground truth: 5);
- Open low-rise (class code in the ground truth: 6);
- Lightweight low-rise (class code in the ground truth: 7);
- Large low-rise (class code in the ground truth: 8);
- Sparsely built (class code in the ground truth: 9);
- Heavy industry (class code in the ground truth: 10).
7 rural LCZs corresponding to various land cover types:
- Dense trees (class code in the ground truth: 11);
- Scattered trees (class code in the ground truth: 12);
- Bush and scrub (class code in the ground truth: 13);
- Low plants (class code in the ground truth: 14);
- Bare rock or paved (class code in the ground truth: 15);
- Bare soil or sand (class code in the ground truth: 16);
- Water (class code in the ground truth: 17).
The contest aims to promote innovation in classification algorithms, as well as to provide objective and fair comparisons among methods. Ranking is based on quantitative accuracy parameters computed with respect to undisclosed test samples from cities unseen during training. Participants will be given a limited time to submit their classification maps after the competition is started. The contest will consist of two steps:
-
Step 1 – training: Participants are provided with five training cities (Berlin, Rome, Paris, Sao Paulo, Hong Kong), including ground truth to train their algorithms.
-
Step 2 – testing on new cities: Participants will receive the data of the test cities and will submit their classification maps by three weeks from the release of this second part of the data set. In parallel, they will submit a short description of the approach used. After evaluation of the results, 4 winners will be announced.
The Data:
- Landsat data, in the form of images with 8 multispectral bands (i.e. visible, short and long infrared wavelengths) resampled at 100m resolution (courtesy of the U.S. Geological Survey);
- Sentinel2 images, with 9 multispectral bands (i.e. visible, vegetation red edges and short infrared wavelengths) resampled at 100m resolution (Contains modified Copernicus Data 2016); participants are encouraged to use the full resolution data, for which a direct link is provided in the data package.
- Ancillary data: Open Street Map (OSM) layers with land use information: building, natural, roads and land-use areas. We also provide rasterized versions of OSM layers at 20m resolution for building and land-use areas, superimposable with the satellite images.
- Moreover, for the training cities only, we also provide ground-truth of the various LCZ classes on several areas of the city (defined as polygons using the class codes above). They are provided as raster layers at 100m resolution, superimposable to the satellite images. The ground-truth for the test set will remain undisclosed and will be used for evaluation of the results.
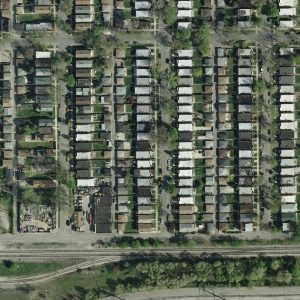
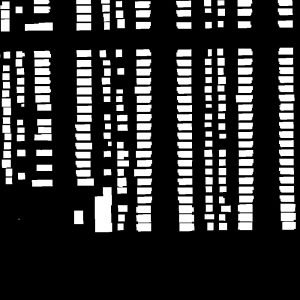
https://zenodo.org/record/1154821#.XH6HtygzbIU
Ground truth of Berlin, Chicago, Paris, Potsdam, and Zurich consist of aerial images from Google Maps and pixel-wise building, road, and background labels from OpenStreetMap.
Ground truth of Tokyo consists of one aerial image from Google Maps and manually generated, pixel-wise building, road, and background labels.
Pixel-wise labels are provided as PNG images in RGB order. Pixels labeled as building, road, and background are indicated by RGB colors [255,0,0], [0,0,255], and [255,255,255].
RGB channel means of aerial images
Berlin R: 79.94162, G: 84.72064, B: 78.94711
Chicago R: 86.46459, G: 85.73488, B: 77.14777
Paris R: 82.46727, G: 92.82243, B: 88.05664
Potsdam R: 74.85480, G: 77.37761, B: 70.22035
Tokyo R: 96.96883, G: 98.44344, B: 108.60135
Zurich R: 62.36962, G: 66.11001, B: 60.32863
Ground truth was generated in Berlin Spring 2016 Chicago Autumn 2015 Paris Autumn 2015 Potsdam Spring 2016 Tokyo Spring 2017 Zurich Autumn 2015
Reference:
- Kaiser P, Wegner J D, Lucchi A, et al. Learning aerial image segmentation from online maps[J]. IEEE Transactions on Geoscience and Remote Sensing, 2017, 55(11): 6054-6068.
4.5. 2018 IEEE GRSS Data Fusion Contest--Advanced multi-sensor optical remote sensing for urban land use and land cover classification
http://www.grss-ieee.org/community/technical-committees/data-fusion/2018-ieee-grss-data-fusion-contest/
http://dase.ticinumaerospace.com

The 2018 Data Fusion Contest consists of a classification benchmark. The task to be performed is urban land use and land cover classification.
To test their synergy as well as individual potential for urban land use and land cover classification, classification results can be submitted to three parallel and independent competitions:
- Data Fusion Classification Challenge (use of at least two data sets)
- Multispectral LiDAR Classification Challenge
- Hyperspectral Classification Challenge
The Data: We provide (Acquired by the National Center for Airborne Laser Mapping, NCALM): The data were acquired by NCALM on February 16, 2017 between 16:31 and 18:18 GMT. Sensors used in this campaign include an Optech Titam MW (14SEN/CON340) with integrated camera (a LIDAR sensor operating at three different laser wavelengths), a DiMAC ULTRALIGHT+ (a very high resolution color imager) with a 70 mm focal length, and an ITRES CASI 1500 (a hyperspectral imager).
- Multispectral-LiDAR point cloud data at 1550 nm, 1064 nm, and 532 nm; Intensity rasters from first return per channel and DSMs at a 50-cm GSD.
- Hyperspectral data covering a 380-1050 nm spectral range with 48 bands at a 1-m GSD.
- Very high resolution RGB imagery at a 5-cm GSD. The image is organized into several separate tiles.
The data were acquired by NCALM on February 16, 2017 between 16:31 and 18:18 GMT. Sensors used in this campaign include an Optech Titam MW (14SEN/CON340) with integrated camera (a LIDAR sensor operating at three different laser wavelengths), a DiMAC ULTRALIGHT+ (a very high-resolution color imager) with a 70mm focal length, and an ITRES CASI 1500 (a hyperspectral imager). The sensors were aboard a Piper PA-31- 350 Navajo Chieftain aircraft.
Moreover, for the training region only, we also provide ground-truth corresponding to 20 urban land use and land cover classes. They are provided as raster at a 0.5-m GSD, superimposable to airborne images.
The ground truth for the test set remains undisclosed and will be used for evaluation of the results.
Urban Land Use and Land Cover Classes:
- 0 – Unclassified
- 1 – Healthy grass
- 2 – Stressed grass
- 3 – Artificial turf
- 4 – Evergreen trees
- 5 – Deciduous trees
- 6 – Bare earth
- 7 – Water
- 8 – Residential buildings
- 9 – Non-residential buildings
- 10 – Roads
- 11 – Sidewalks
- 12 – Crosswalks
- 13 – Major thoroughfares
- 14 – Highways
- 15 – Railways
- 16 – Paved parking lots
- 17 – Unpaved parking lots
- 18 – Cars
- 19 – Trains
- 20 – Stadium seats
http://earthvisionlab.whu.edu.cn/zm/SemanticSegmentation/index.html
The EvLab-SS benchmark is designed for the evaluation of the semantic segmentation algorithms on real engineered scenes, which aims to find a good deep learning architecture for the high resolution pixel-wise classification task in remote sensing area.
The dataset is originally obtained from the Chinese Geographic Condition Survey and Mapping Project, and each image is fully annotated by the Geographic Conditions Survey (NO.GDPJ 01—2013) standards. The average resolution of the dataset is approximately 4500 × 4500 pixels. The EvLab-SS dataset contains 11 major classes, namely, background, farmland, garden, woodland, grassland, building, road, structures, digging pile, desert and waters, and currently includes 60 frames of images captured by different platforms and sensors. The dataset comprises 35 satellite images, 19 frames of which are captured by the World-View-2 satellite (re-sample GSD 0.2 m), 5 frames are captured by the GeoEye satellite (re-sample GSD 0.5 m), **5 frames **are captured by the QuickBird satellite (re-sample GSD 2 m), 6 frames are captured by the GF-2 satellite (re-sample GSD 1 m). The dataset also has 25 aerial images, 10 images of which with spatial resolution of 0.25 m and 15 images have a spatial resolution of 0.1 m.
Reference:
- Zhang M, Hu X, Zhao L, et al. Learning dual multi-scale manifold ranking for semantic segmentation of high-resolution images[J]. Remote Sensing, 2017, 9(5): 500.
http://deepglobe.org/index.html
https://competitions.codalab.org/competitions/18468
Automatic categorization and segmentation of land cover is of great importance for sustainable development, autonomous agriculture, and urban planning. We would like to introduce the challenge of automatic classification of land cover types. This problem is defined as a multi-class segmentation task to detect areas of urban, agriculture, rangeland, forest, water, barren, and unknown. The evaluation will be based on the accuracy of the class labels.
Reference:
- Demir I, Koperski K, Lindenbaum D, et al. DeepGlobe 2018: A Challenge to Parse the Earth through Satellite Images[J]. arXiv preprint arXiv:1805.06561, 2018.
http://captain.whu.edu.cn/GID/
Gaofen Image Dataset (GID) a large-scale dataset for land use and land cover (LULC) classification. It contains 150 high-quality Gaofen-2 (GF-2) images acquired from more than 60 different cities in China. And these images cover the geographic areas that exceed 50,000 km2. Images in GID have high intra-class diversity coupled with low inter-class separability. Therefore, GID can provide the research community with a high-quality data resource to advance the state-of-the-art in LULC classification.
Reference:
- Tong X Y, Xia G S, Lu Q, et al. Learning Transferable Deep Models for Land-Use Classification with High-Resolution Remote Sensing Images[J]. arXiv preprint arXiv:1807.05713, 2018.
http://www.grss-ieee.org/community/technical-committees/data-fusion/
- Track 1: Single-view Semantic 3D Challenge
- Track 2: Pairwise Semantic Stereo Challenge
- Track 3: Multi-view Semantic Stereo Challenge
- Track 4: 3D Point Cloud Classification Challenge
Reference:
- Bosch, M. ; Foster, G. ; Christie, G. ; Wang, S. ; Hager, G.D. ; Brown, M. : Semantic Stereo for Incidental Satellite Images. Proc. of Winter Conf. on Applications of Computer Vision, 2019.
https://github.com/SorourMo/38-Cloud-A-Cloud-Segmentation-Dataset


Red Green Blue NIR False color Ground truth
This dataset contains 38 Landsat 8 scene images and their manually extracted pixel-level ground truths for cloud detection. 38-Cloud dataset is introduced in [1], yet it is a modification of the dataset in [2].
The entire images of these scenes are cropped into multiple 384*384 patches to be proper for deep learning-based semantic segmentation algorithms. There are 8400 patches for training and 9201 patches for testing. Each patch has 4 corresponding spectral channels which are Red (band 4), Green (band 3), Blue (band 2), and Near Infrared (band 5). Unlike other computer vision images, these channels are not combined together. Instead, they are in their correspondig directories.
Reference:
- Mohajerani S, Krammer T A, Saeedi P. Cloud Detection Algorithm for Remote Sensing Images Using Fully Convolutional Neural Networks[J]. arXiv preprint arXiv:1810.05782, 2018.
- Mohajerani S, Saeedi P. Cloud-Net: An end-to-end Cloud Detection Algorithm for Landsat 8 Imagery[J]. arXiv preprint arXiv:1901.10077, 2019.
http://eo-learn.sentinel-hub.com/
Land Cover Classification with eo-learn: Part 1
Land Cover Classification with eo-learn: Part 2
Land Cover Classification with eo-learn: Part 3
http://eo-learn.sentinel-hub.com/
eopatches_slovenia_2017_full.zip 187.0 GB
eopatches_slovenia_2017_sample.zip 2.7 GB
The full dataset contains 293 EOPatches of the size of about 1000 x 1000 pixels at 10 m resolution, while the sample dataset contains 4 EOPatches from a 2x2 grid.
Each EOPatch is a container of EO and non-EO data.
https://github.com/ishann/aeroscapes
The AeroScapes aerial semantic segmentation benchmark comprises of images captured using a commercial drone from an altitude range of 5 to 50 metres. The dataset provides 3269 720p images and ground-truth masks for 11 classes.

Reference:
- Nigam I, Huang C, Ramanan D. Ensemble knowledge transfer for semantic segmentation[C]//2018 IEEE Winter Conference on Applications of Computer Vision (WACV). IEEE, 2018: 1499-1508.
arxiv download (510 GB, 542.000 files)
SEN12MS is a dataset consisting of 180,748 corresponding image triplets containing Sentinel-1 dual-pol SAR data, Sentinel-2 multi-spectral imagery, and MODIS-derived land cover maps.
https://www.microsoft.com/en-us/research/project/land-cover-mapping/
http://lila.science/datasets/chesapeakelandcover
This dataset contains high-resolution aerial imagery from the USDA NAIP program [1], high-resolution land cover labels from the Chesapeake Conservancy [2], low-resolution land cover labels from the USGS NLCD 2011 dataset [3], low-resolution multi-spectral imagery from Landsat 8 [4], and high-resolution building footprint masks from Microsoft Bing [5], formatted to accelerate machine learning research into land cover mapping. The Chesapeake Conservancy spent over 10 months and $1.3 million creating a consistent six-class land cover dataset covering the Chesapeake Bay watershed. While the purpose of the mapping effort by the Chesapeake Conservancy was to create land cover data to be used in conservation efforts, the same data can be used to train machine learning models that can be applied over even wider areas.
The organization of this dataset (detailed below) will allow users to easily test questions related to this problem of geographic generalization, i.e. how to train machine learning models that can be applied over even wider areas. For example, this dataset can be used to directly estimate how well a model trained on data from Maryland can generalize over the remainder of the Chesapeake Bay.
Python code for training and testing deep learning models (Keras/TensorFlow based) can be found in the accompanying GitHub repository:
https://github.com/calebrob6/land-cover
Further developments in models and related tools can be found at:
https://github.com/Microsoft/landcover
Reference:
- Robinson C, Hou L, Malkin K, Soobitsky R, Czawlytko J, Dilkina B, Jojic N. Large Scale High-Resolution Land Cover Mapping with Multi-Resolution Data. Proceedings of the 2019 Conference on Computer Vision and Pattern Recognition
https://semcity.ipb.uni-bonn.de/
https://github.com/isprs-semcity
https://www.dlr.de/eoc/en/desktopdefault.aspx/tabid-12760/22294_read-58694
https://github.com/smajida/SkyScapes

High-Definition(HD) mapping is in many applications from autonomous driving to infrastructure monitoring, and urban management essential for the understanding of complex urban infrastructure with centimeter-level accuracy. Aerial images provide valuable information over a large area instantaneously; nevertheless, no current dataset captures the complexity of aerial scenes at the level of granularity required by real-world applications. To address this, we introduce SkyScapes, an aerial image dataset with highly-accurate, fine-grained annotations for pixel-level semantic labeling. SkyScapes provides annotations for 31 semantic categories ranging from large structures, such as buildings, roads and vegetation, to fine details, such as 12 (sub-)categories of lane markings. DLR-SkyScapes has been used and published in [1].
Reference:
- S. Azimi, C. Henry, L. Sommer, A. Schaumann, and E. Vig, " Skyscapes -- Fine-Grained Semantic Understanding of Aerial Scenes," in International Conference on Computer Vision (ICCV), October 2019.
https://www.cs.toronto.edu/~vmnih/data/
The size of all images in these datasets is 1500×1500, and the resolution is 1m2/pixel.
The buildingdataset consists of 137 sets of aerial images and corresponding single-channel label images for training part, 10 for testing part, and 4 for validation part.
Reference:
- Mnih V. Machine learning for aerial image labeling[D]. University of Toronto (Canada), 2013.
https://spacenetchallenge.github.io/
The Data - Over 685,000 footprints across the Five SpaceNet Areas of Interest.
| AOI | Area of Raster (Sq. Km) | Building Labels (Polygons) |
|---|---|---|
| AOI_1_Rio | 2,544 | 382,534 |
| AOI_2_Vegas | 216 | 151,367 |
| AOI_3_Paris | 1,030 | 23,816 |
| AOI_4_Shanghai | 1,000 | 92,015 |
| AOI_5_Khartoum | 765 | 35,503 |
5.3. Aerial imagery object identification dataset for building and road detection, and building height estimation
url: https://figshare.com/collections/Aerial_imagery_object_identification_dataset_for_building_and_road_detection_and_building_height_estimation/3290519
Automated object detection in high-resolution aerial imagery can provide valuable information in fields ranging from urban planning and operations to economic research, however, automating the process of analyzing aerial imagery requires training data for machine learning algorithm development. This dataset seeks to meet that need. For 25 locations across 9 U.S. cities, this dataset provides (1) high resolution aerial imagery; (2) annotations of over 40,000 building footprints (OSM shapefiles) as well as road polylines; and (3) topographical height data (LIDAR) . This dataset can be used as ground truth to train computer vision and machine learning algorithms for object identification and analysis, in particular for building detection and height estimation, as well as road detection.
A complete description of the data can be found in the pdf file within the metadata for this collection, titled, “Metadata - building (area and height) and road dataset”. This data collection is organized such that there is a separate dataset in this collection for each of the 9 cities with available data (Arlington, MA; Atlanta, GA; Austin TX; Washington, DC; New Haven, CT; New York City, NY; Norfolk, VA; San Francisco, CA; Seekonk, MA). A map of these cities and example images can be found here: http://arcg.is/2afcSOk.
Imagery data from the United States Geological Survey (USGS); building and road shapefiles are from OpenStreetMaps (OSM) (these OSM data are made available under the Open Database License: http://opendatacommons.org/licenses/odbl/1.0/); and the Lidar data are from U.S. National Oceanic and Atmospheric Administration (NOAA), the Texas Natural Resources Information System (TNRIS).
Reference:
@misc{bradbury_brigman_collins_johnson_lin_newell_park_suresh_wiesner_xi_2016,
title={Aerial imagery object identification dataset for building and road detection, and building height estimation},
DOI={10.6084/m9.figshare.c.3290519.v1},
publisher={figshare},
author={Bradbury, Kyle and Brigman, Benjamin and Collins, Leslie and Johnson, Timothy and Lin, Sebastian and Newell, Richard and Park, Sophia and Suresh, Sunith and Wiesner, Hoel and Xi, Yue},
year={2016},
month={Jul}}
https://project.inria.fr/aerialimagelabeling/
The Inria Aerial Image Labeling addresses a core topic in remote sensing: the automatic pixelwise labeling of aerial imagery (link to paper).
Dataset features:
- Coverage of 810 km² (405 km² for training and 405 km² for testing)
- Aerial orthorectified color imagery with a spatial resolution of 0.3 m
- Ground truth data for two semantic classes: building and not building (publicly disclosed only for the training subset)
- The images cover dissimilar urban settlements, ranging from densely populated areas (e.g., San Francisco’s financial district) to alpine towns (e.g,. Lienz in Austrian Tyrol).
Instead of splitting adjacent portions of the same images into the training and test subsets, different cities are included in each of the subsets. For example, images over Chicago are included in the training set (and not on the test set) and images over San Francisco are included on the test set (and not on the training set). The ultimate goal of this dataset is to assess the generalization power of the techniques: while Chicago imagery may be used for training, the system should label aerial images over other regions, with varying illumination conditions, urban landscape and time of the year.
Reference:
- Maggiori E, Tarabalka Y, Charpiat G, et al. Can semantic labeling methods generalize to any city? The INRIA aerial image labeling benchmark[C]//IEEE International Symposium on Geoscience and Remote Sensing (IGARSS). 2017.
https://www.topcoder.com/urban3d
https://spacenetchallenge.github.io/datasets/Urban_3D_Challenge_summary.html
https://github.com/topcoderinc/Urban3d
This challenge published a large-scale dataset containing 2D orthrorectified RGB and 3D Digital Surface Models and Digital Terrain Models generated from commercial satellite imagery covering over 360 km of terrain and containing roughly 157,000 annotated building footprints. All imagery products are provided at 50 cm ground sample distance (GSD). This unique 2D/3D large scale dataset provides researchers an opportunity to utilize machine learning techniques to further improve state of the art performance.
Reliable labeling of buildings based on satellite imagery is one of the first and most challenging steps in producing accurate 3D models and maps. While automated algorithms continue to improve, significant manual effort is still necessary to ensure geospatial accuracy and acceptable quality. Improved automation is required to enable more rapid response to major world events such as humanitarian and disaster response. 3D height data can help improve automated building labeling performance, and capabilities for providing this data on a global scale are now emerging. In this challenge, we ask solvers to use satellite imagery and newly available 3D height data products to improve upon the state of the art for automated building detection and labeling.
USSOCOM is seeking an algorithm that provides reliable, automatic labeling of buildings based solely on orthorectified color satellite imagery and 3D height data.
Reference:
- H. Goldberg, M. Brown, and S. Wang, A Benchmark for Building Footprint Classification Using Orthorectified RGB Imagery and Digital Surface Models from Commercial Satellites, 46th Annual IEEE Applied Imagery Pattern Recognition Workshop, Washington, D.C, 2017.
- H. Goldberg, S. Wang, M. Brown, and G. Christie. Urban 3D Challenge: Building Footprint Detection Using Orthorectified Imagery and Digital Surface Models from Commercial Satellites. In Proceedings SPIE Defense and Commercial Sensing: Geospatial Informatics and Motion Imagery Analytics VIII, Orlando, Florida, USA, 2018.
http://deepglobe.org/index.html
https://competitions.codalab.org/competitions/18544
Modeling population dynamics is of great importance for disaster response and recovery, and detection of buildings and urban areas are key to achieve so. We would like to pose the challenge of automatically detecting buildings from satellite images. This problem is formulated as a binary segmentation problem to localize all building polygons in each area. The evaluation will be based on the overlap of detected polygons with the ground truth.
Reference:
- Demir I, Koperski K, Lindenbaum D, et al. DeepGlobe 2018: A Challenge to Parse the Earth through Satellite Images[J]. arXiv preprint arXiv:1805.06561, 2018.
https://www.crowdai.org/challenges/mapping-challenge

In this challenge you will be provided with a dataset of individual tiles of satellite imagery as RGB images, and their corresponding annotations of where an image is there a building. The goal is to train a model which given a new tile can annotate all buildings.
- train.tar.gz : This is the Training Set of 280741 tiles (as 300x300 pixel RGB images) of satellite imagery, along with their corresponding annotations in MS-COCO format
- val.tar.gz: This is the suggested Validation Set of 60317 tiles (as 300x300 pixel RGB images) of satellite imagery, along with their corresponding annotations in MS-COCO format
- test_images.tar.gz : This is the Test Set for Round-1, where you are provided with 60697 files (as 300x300 pixel RGB images) and your are required to submit annotations for all these files.
http://study.rsgis.whu.edu.cn/pages/download/ This dataset consists of an aerial dataset and a satellite dataset.
1、 Aerial imagery dataset
The original aerial data comes from the New Zealand Land Information Services website. We manually edited Christchurch's building vector data, with about 22,000 independent buildings. The original ground resolution of the images is 0.075m.
we provide manually edited shapefile corresponds to the whole area.
We also down-sampled the most parts of aerial images (including 18,7000 buildings) to 0.3m ground resolution, and cropped them into 8,189 tiles with 512×512 pixels. The shapefile is also rasterized. The ready-to-use samples are divided into three parts: a training set (130,500 buildings), a validation set (14,500 buildings) and a test set (42,000 buildings).
Training area:4736 tiles, Evaluation area: 1036 tiles, Test area: 2416 tiles

2、 Satellite dataset I (global cities)
One of them is collected from cities over the world and from various remote sensing resources including QuickBird, Worldview series, IKONOS, ZY-3, etc. We manually delineated all the buildings. It contains 204 images (512 × 512 tiles with resolutions varying from 0.3 m to 2.5 m). Besides the differences in satellite sensors, the variations in atmospheric conditions, panchromatic and multispectral fusion algorithms, atmospheric and radiometric corrections and season made the samples suitable yet challenging for testing robustness of building extraction algorithms.

3、 Satellite dataset Ⅱ (East Asia)
The other satellite building sub-dataset consists of 6 neighboring satellite images covering 550 km2 on East Asia with 2.7 m ground resolution. This test area is mainly designed to evaluate and to develop the generalization ability of a deep learning method on different data sources but with similar building styles in the same geographical area. The vector building map is also fully manually delineated in ArcGIS software and contains 29085 buildings. The whole image is seamlessly cropped into 17388 512×512 tiles for convenient training and testing with the same processing as in our aerial dataset. Among them 21556 buildings (13662 tiles) are separated for training and the rest 7529 buildings (3726 tiles) are used for testing.
Training area: 13662 tiles
Test area: 3726 tiles

4、 Building change detection dataset
Our dataset covers an area where a 6.3-magnitude earthquake has occurred in February 2011 and rebuilt in the following years. This dataset consists of aerial images obtained in April 2012 that contains 12796 buildings in 20.5 km2 (16077 buildings in the same area in 2016 dataset). By manually selecting 30 GCPs on ground surface, the sub-dataset was geo-rectified to the aerial dataset with 1.6-pixel accuracy. This sub-dataset and the corresponding images from the original dataset are now openly provided along with building vector and raster maps.

Reference:
- Ji S, Wei S, Lu M. Fully Convolutional Networks for Multisource Building Extraction From an Open Aerial and Satellite Imagery Data Set[J]. IEEE Transactions on Geoscience and Remote Sensing, 2018 (99): 1-13.
https://www.airs-dataset.com/
AIRS (Aerial Imagery for Roof Segmentation) is a public dataset that aims at benchmarking the algorithms of roof segmentation from very-high-resolution aerial imagery. The main features of AIRS can be summarized as:
- 457km2 coverage of orthorectified aerial images with over 220,000 buildings
- Very high spatial resolution of imagery (0.075m)
- Refined ground truths that strictly align with roof outlines
AIRS dataset covers almost the full area of Christchurch, the largest city in the South Island of New Zealand. The photography was taken during the flying seasons of 2015 and 2016, and the supplied images are ortho-rectified DOMs with RGB channels and 7.5cm resolution in projection of New Zealand Transverse Mercator. There are 226,342 labeled buildings within the whole area for experiment. To eliminate the impact of relief displacement, the ground truths for buildings are carefully refined to align with their roofs. Therefore, the segmentation task posed for AIRS contains two semantic classes: roof and non-roof pixels.
Reference:
- Chen Q, Wang L, Wu Y, et al. Aerial Imagery for Roof Segmentation: A Large-Scale Dataset towards Automatic Mapping of Buildings[J]. arXiv preprint arXiv:1807.09532, 2018.
- Chen Q, Wang L, Wu Y, et al. Aerial imagery for roof segmentation: A large-scale dataset towards automatic mapping of buildings[J]. ISPRS Journal of Photogrammetry and Remote Sensing, 2019, 147: 42-55.
https://competitions.codalab.org/competitions/20100

Training data can be obtained from the following Google Sheet: https://docs.google.com/spreadsheets/d/1tP133OqpwvkzHnkmS_3nezpTJMq06tpPM6P2qU6kaZ4/edit?usp=sharing
https://www.topcoder.com/spacenet
https://community.topcoder.com/longcontest/?module=ViewProblemStatement&rd=17313&compid=71676
https://spacenetchallenge.github.io/datasets/spacenet-OffNadir-summary.html
Your task will be to extract building footprints from increasingly off-nadir satellite images. The polygons you create will be compared to ground truth, and the quality of the solutions will be measured using the SpaceNet metric.
This dataset contains 27 8-Band WorldView-2 images taken over Atlanta, GA on December 22nd, 2009. They range in off-nadir angle from 7 degrees to 54 degrees. For the competition, the 27 images are broken into 3 segments based on their off-nadir angle:
- Nadir: 0-25 degrees
- Off-nadir: 26 degrees - 40 degrees
- Very Off-nadir 40-55 degrees
The entire set of images is tiled into 450m x 450m tiles.
The training data has 27 folders. “Atlanta_nadir{Off-Nadir Angle}catid{CatalogID}”
Each Collection folder than has 3 types of images are available for the target areas:
- PAN: panchromatic (single channel, 16-bit grayscale, ~50 cm resolution)
- MUL: 8-band multi-channel (8*16-bit, ~2m resolution). This is the equivalent of the 8-band images from the first and second competition.
- PanSharpen: pan-sharpened version of Red-Green-Blue+NIR1 bands from the multispectral product (4 channels, 3*16-bit, ~50 cm resolution). This is formed by using the PAN image to interpolate 4 bands of the MUL dataset to increase the resolution of the Red, Green and Blue bands.
http://im.itu.edu.pk/deepcount/
https://arxiv.org/pdf/1904.00674.pdf
With over 550,000 building polygons from seven different types of natural disaster around the world, covering a total area of over 19,000 square kilometers, the xBD dataset is one of the largest and highest quality public datasets of annotated high-resolution satellite imagery.
Buildings around the world are as diverse as the conditions they face. The xBD dataset includes pre- and post-disaster imagery for seven different types of disaster and fifteen countries.

Reference:
- Ritwik Gupta, Bryce Goodman, Nirav Patel, Ricky Hosfelt, Sandra Sajeev, Eric Heim, Jigar Doshi, Keane Lucas, Howie Choset, Matthew Gaston; The IEEE Conference on Computer Vision and Pattern Recognition (CVPR) Workshops, 2019, pp. 10-17
https://www.cs.toronto.edu/~vmnih/data/
The size of all images in these datasets is 1500×1500, and the resolution is 1m2/pixel.
The road dataset consists of 1108 sets for training part, 49 for testingpart, and 14 for validation part.
Reference:
- Mnih V. Machine learning for aerial image labeling[D]. University of Toronto (Canada), 2013.
https://spacenetchallenge.github.io/
The Data - Over 8000 Km of roads across the four SpaceNet Areas of Interest.
| AOI | Area of Raster (Sq. Km) | Road Centerlines (LineString) |
|---|---|---|
| AOI_2_Vegas | 216 | 3685 km |
| AOI_3_Paris | 1,030 | 425 km |
| AOI_4_Shanghai | 1,000 | 3537 km |
| AOI_5_Khartoum | 765 | 1030 km |
Road Type Breakdown (km of Road)
| Road Type | AOI_2_Vegas | AOI_3_Paris | AOI_4_Shanghai | AOI_5_Khartoum | Total |
|---|---|---|---|---|---|
| Motorway | 115 | 9 | 102 | 13 | 240 |
| Primary | 365 | 14 | 192 | 98 | 669 |
| Secondary | 417 | 58 | 501 | 66 | 1042 |
| Tertiary | 3 | 11 | 34 | 68 | 115 |
| Residential | 1646 | 232 | 939 | 485 | 3301 |
| Unclassified | 1138 | 95 | 1751 | 165 | 3149 |
| Cart track | 2 | 6 | 19 | 135 | 162 |
| Total | 3685 | 425 | 3537.9 | 1030 | 8677 |
http://deepglobe.org/index.html
https://competitions.codalab.org/competitions/18467
In disaster zones, especially in developing countries, maps and accessibility information are crucial for crisis response. We would like to pose the challenge of automatically extracting roads and street networks from satellite images.
Reference:
- Demir I, Koperski K, Lindenbaum D, et al. DeepGlobe 2018: A Challenge to Parse the Earth through Satellite Images[J]. arXiv preprint arXiv:1805.06561, 2018.
6.4 SpaceNet5:Automated Road Network Extraction and Route Travel Time Estimation from Satellite Imagery
https://spacenet.ai/sn5-challenge/
The SpaceNet 5 challenge seeks to build upon the advances from SpaceNet 3 and test challenge participants to automatically extract road networks and routing information from satellite imagery, along with travel time estimates along all roadways, thereby permitting true optimal routing.
The task of this challenge is to output a detailed graph structure with edges corresponding to roadways and nodes corresponding to intersections and end points, with estimates for route travel times on all detected edges. You can find a detailed description of CosmiQ Works’ algorithmic baseline on their blog at The DownLinQ.
SpaceNet has open sourced new data sets for the following cities: Moscow, Russia; Mumbai, India; and San Juan, Puerto Rico. For the first time in SpaceNet history, the final submissions will be tested on a mystery city data set that will be revealed and open sourced at the end of the Challenge!
Algorithmic Baseline
The algorithmic baseline for this Challenge is available at this Github link. An explanation of the baseline model, City Scale Road Extraction from Satellite Imagery v2 (CRESIv2), its performance results, and instructions on how to scale automated analysis to large images can be found here.
| AOI | Area of Raster (Sq. Km) | Road Network Labels (Km) |
|---|---|---|
| AOI_7_Moscow | 1,353 | 3,066 |
| AOI_8_Mumbai | 1,021 | 1,951 |
| AOI_9_San Juan | 285 | 1,139 |
| AOI_10_Mystery City | 220 | 2,004 |
Catalog
The data is hosted on AWS as a Public Dataset. It is free to download, but an AWS account is required.
aws s3 ls s3://spacenet-dataset/spacenet/SN5_roads/
https://sites.google.com/site/hrsc2016/
http://www.escience.cn/people/liuzikun/DataSet.html
All the images are collected from six famous harbors. The image resolutions are between 2-m and 0.4-m. The image sizes range from 300 to 1500 and most of them arelarger than 1000 x 600.
Training, validation and test set contains 436 images including 1207 samples, 181 images including 541 samples and 444 images including 1228 samples respectively.
Reference:
- Liu Z, Yuan L, Weng L, et al. A High Resolution Optical Satellite Image Dataset for Ship Recognition and Some New Baselines[C]//ICPRAM. 2017: 324-331.
http://opensar.sjtu.edu.cn/
OpenSAR is an open SAR image management and processing platform developed by Advanced Sensing Technology Center (AST) of Shanghai Jiao Tong University for SAR image reading, processing, visualizing and algorithm testing. SAR image management and algorithm testing are the main tasks of OpenSAR. OpenSAR supports importing various SAR data source such as TerraSAR-X, RADARSAT 1/2, COSMO-SkyMed, etc. The users can search and view SAR image data by this platform. OpenSAR supports registering various algorithms such as image denoising, scene classification, target detection, target recognition, change detection, etc. The users can search, configure and execute these algorithms by this platform. A complete testing report will also be provided to the users.
Reference:
- Huang L, Liu B, Li B, et al. OpenSARShip: A Dataset Dedicated to Sentinel-1 Ship Interpretation[J]. IEEE Journal of Selected Topics in Applied Earth Observations and Remote Sensing, 2017.
https://www.kaggle.com/c/airbus-ship-detection
http://www.iuii.ua.es/datasets/masati/
This dataset provides maritime scenes of optical aerial images from visible spectrum. The MASATI dataset contains color images in dynamic marine environments, and it can be used to evaluate ship detection methods. Each image may contain one or multiple targets in different weather and illumination conditions. The datasets is composed of 6212 satellite images labeled according to the following seven classes: land, coast, sea, ship, multi, coast-ship, and detail.
The satellite images were acquired from Bing Maps in RGB and with different sizes, as size is dependent on the region of interest to be registered in the image. In general, the average image size has a spatial resolution around 512 x 512 pixels. The images are stored as PNG where pixel values represent RGB colors. The distance between targets and the acquisition satellite has also been changed in order to obtain captures at different altitudes.
Reference:
- Gallego A J, Pertusa A, Gil P. Automatic Ship Classification from Optical Aerial Images with Convolutional Neural Networks[J]. Remote Sensing, 2018, 10(4): 511.
https://github.com/CAESAR-Radi/SAR-Ship-Dataset
This dataset labeled by SAR experts was created using 102 Chinese Gaofen-3 images and 108 Sentinel-1 images. It consists of 43,819 ship chips of 256 pixels in both range and azimuth. These ships mainly have distinct scales and backgrounds. It can be used to develop object detectors for multi-scale and small object detection.
Reference:
- A SAR Dataset of Ship Detection for Deep Learning under Complex Backgrounds." Remote Sensing 11 (7). doi: 10.3390/rs11070765.
https://github.com/DYH666/DSCR
collect 1,951 remote sensing images from DOTA, HRSC2016, NWPU VHR-10 and Go ogle Earth, containing warships and civilian ships of various scales. For ob ject classification, we cut out ships of different categories from the collected images. The whole dataset contains ab out 20,675 instances which are divided into seven categories, i.e. aircraft carrier, destroyer, assault ship, combat ship, cruiser, other military ship and civilian ship. Each image contains ships of the same category, which is labeled by the category name.
Reference:
- Yanghua Di, Zhiguo Jiang, Haopeng Zhang, and Gang Meng "A public dataset for ship classification in remote sensing images", Proc. SPIE 11155, Image and Signal Processing for Remote Sensing XXV, 111551M (7 October 2019); https://doi.org/10.1117/12.2532741
https://rcdaudt.github.io/oscd/
The Onera Satellite Change Detection (OSCD) dataset address the issue of detecting changes between satellite images at different dates.
It comprises 24 pairs of multispectral images taken from the Sentinel-2 satellite in 2015 and 2018. Locations are picked all over the world, in North and South America, Europe, Middle-East and Asia. For each location, registered pairs of 13-band multispectral satellite images obtained by the Sentinel-2 satellites are provided. Images vary in spatial resolution between 10m, 20m and 60m.
Pixel-level change groundtruth is provided for 14 of the image pairs. The annotated changes focus on urban changes, such as new buildings or new roads. These data can be used for training and setting parameters of change detection algorithms.
References:

- Urban Change Detection for Multispectral Earth Observation Using Convolutional Neural Networks R. Caye Daudt, B. Le Saux, A. Boulch, Y. Gousseau IEEE International Geoscience and Remote Sensing Symposium (IGARSS’2018) Valencia, Spain, July 2018
https://computervisiononline.com/dataset/1105138664
https://land.copernicus.eu/local/urban-atlas
http://www.pshrcd.com/#/intro
https://kelvins.esa.int/proba-v-super-resolution/
In this competition you are given multiple images of each of 78 Earth locations and you are asked to develop an algorithm to fuse them together into a single one. The result will be a "super-resolved" image that is checked against a high resolution image taken from the same satellite, PROBA-V. The 'V' stands for Vegetation, which is the main focus of the on-board instruments. Can you enhance the vision of PROBA-V and help us advance the accuracy on monitoring earths vegetation growth?
http://aiskyeye.com/
The VisDrone2018 dataset is collected by the AISKYEYE team at Lab of Machine Learning and Data Mining , Tianjin University, China. The benchmark dataset consists of 263 video clips formed by 179,264 frames and 10,209 static images, captured by various drone-mounted cameras, covering a wide range of aspects including location (taken from 14 different cities separated by thousands of kilometers in China), environment (urban and country), objects (pedestrian, vehicles, bicycles, etc.), and density (sparse and crowded scenes). Note that, the dataset was collected using various drone platforms (i.e., drones with different models), in different scenarios, and under various weather and lighting conditions. These frames are manually annotated with more than 2.5 million bounding boxes of targets of frequent interests, such as pedestrians, cars, bicycles, and tricycles. Some important attributes including scene visibility, object class and occlusion, are also provided for better data utilization.
four tasks:
- (1) Task 1: object detection in images challenge. The task aims to detect objects of predefined categories (e.g., cars and pedestrians) from individual images taken from drones.
- (2) Task 2: object detection in videos challenge. The task is similar to Task 1, except that objects are required to be detected from videos.
- (3) Task 3: single-object tracking challenge. The task aims to estimate the state of a target, indicated in the first frame, in the subsequent video frames.
- (4) Task 4: multi-object tracking challenge. The task aims to recover the trajectories of objects with (Task 4B) or without (Task 4A) the detection results in each video frame.
References:
- Pengfei Zhu, Longyin Wen, Xiao Bian, Haibin Ling and Qinghua Hu, arXiv 2018. Vision Meets Drones: A Challenge.
https://www.highd-dataset.com/
The highD dataset is a new dataset of naturalistic vehicle trajectories recorded on German highways. Using a drone, typical limitations of established traffic data collection methods such as occlusions are overcome by the aerial perspective. Traffic was recorded at six different locations and includes more than 110 000 vehicles. Each vehicle's trajectory, including vehicle type, size and manoeuvres, is automatically extracted. Using state-of-the-art computer vision algorithms, the positioning error is typically less than ten centimeters. Although the dataset was created for the safety validation of highly automated vehicles, it is also suitable for many other tasks such as the analysis of traffic patterns or the parameterization of driver models.
References:
- Krajewski R, Bock J, Kloeker L, et al. The highD Dataset: A Drone Dataset of Naturalistic Vehicle Trajectories on German Highways for Validation of Highly Automated Driving Systems[J]. arXiv preprint arXiv:1810.05642, 2018.
References:
- The UAVid Dataset for Video Semantic Segmentation[J]. arXiv preprint arXiv:1810.10438, 2018.
http://vision.middlebury.edu/stereo/data/
http://www.cvlibs.net/datasets/kitti/eval_scene_flow.php?benchmark=flow
https://lmb.informatik.uni-freiburg.de/resources/datasets/SceneFlowDatasets.en.html
https://www.eth3d.net/
References:
- Schöps T, Schönberger J L, Galliani S, et al. A multi-view stereo benchmark with high-resolution images and multi-camera videos[C]//Conference on Computer Vision and Pattern Recognition (CVPR). 2017, 2017.
一共提供了两组航空实验数据,一组是高楼林立的加拿大Toronto地区,另一组是半农村地区的德国Vaihingen地区。两组数据的航向重叠度为60%,旁向重叠度为30%。真值为LAS点云。 德国Vaihingen(斯图加特)地区有25张影像,4条航带 加拿大Toronto(多伦多)地区有13张影像,3条航带
http://www2.isprs.org/commissions/comm1/icwg15b/benchmark_main.html
http://www2.isprs.org/commissions/comm1/icwg15b/benchmark/description_Dortmund.html
http://www2.isprs.org/commissions/comm1/icwg15b/benchmark/Benchmark_Aim.html
两个地区Zurich(苏黎世) 和 Dortmund (Zeche Zollern)(多特蒙德)
见EuroSDR航空影像密集匹配数据


http://www.ifp.uni-stuttgart.de/ISPRS-EuroSDR/ImageMatching/index.en.html
Dortmund (Zeche Zollern)(多特蒙德)见红色区域
References:
- Nex,F.,Gerke,M.,Remondino,F.,Przybilla H.-J.,Bäumker,M.,Zurhorst,A.,2015。ISPRS Benchmark for Multi-Platform Photogrammetry。ISPRS Annals of the Photogrammetry,Remote Sensing and Spatial Information Sciences,Vol。II-3 / W4,pp.135-142.
http://www.ifp.uni-stuttgart.de/ISPRS-EuroSDR/ImageMatching/index.en.html
试验数据包括两组垂直摄影和一组倾斜摄影。倾斜数据的覆盖区域是瑞士Zurich(苏黎世),地面分辨率为6~13 cm,垂直影像的覆盖区域分别是德国Vaihingen(斯图加特)(地面分辨率为20 cm)和München(慕尼黑)(地面分辨率为10 cm)。
References:
- Cavegn, S., Haala, N., Nebiker, S., Rothermel, M. & Tutzauer, P., 2014. Benchmarking High Density Image Matching for Oblique Airborne Imagery. In: Int. Arch. Photogramm. Remote Sens. Spatial Inf. Sci., Zürich, Switzerland, Vol. XL-3, pp. 45-52.
https://www.iarpa.gov/challenges/3dchallenge.html
https://spacenetchallenge.github.io/datasets/mvs_summary.html
http://www.jhuapl.edu/pubgeo/satellite-benchmark.html
https://gfacciol.github.io/multi-date-stereo/
This data set includes DigitalGlobe WorldView-3 panchromatic and multispectral images of a 100 square kilometer area near San Fernando, Argentina. We also provide 20cm airborne lidar ground truth data for a 20 square kilometer subset of this area and performance analysis software to assess accuracy and completeness metrics. Commercial satellite imagery is provided courtesy of DigitalGlobe, and ground truth lidar is provided courtesy of IARPA.
Catalog
aws s3 ls s3://spacenet-dataset/mvs_dataset
The catalog contains the following packages:
- Updated metric analysis software with examples from contest winners
- Challenge data package with instructions, cropped TIFF images, ground truth, image cropping software, and metric scoring software (1.2 GB)
- JHU/APL example MVS solution (451 MB)
- NITF panchromatic, multispectral, and short-wave infrared DigitalGlobe WorldView-3 satellite images (72.1 GB)
- LAZ lidar point clouds with SBET (2.2 GB)
- Spectral image calibration software (84 MB)
Reference:
- M. Bosch, A. Leichtman, D. Chilcott, H. Goldberg, M. Brown. “Metric Evaluation Pipeline for 3D Modeling of Urban Scenes”, ISPRS Archives, 2017.
- M. Bosch, Z. Kurtz, S. Hagstrom, and M. Brown. “A multiple view stereo benchmark for satellite imagery”. In Proceedings of the Applied Imagery Pattern Recognition Workshop (AIPR), Washington, DC, USA, 2016
- G. Facciolo, C. de Franchis, E. Meinhardt-Llopis, “Automatic 3D Reconstruction from Multi-Date Satellite Images,” IEEE International Conference on Computer Vision and Pattern Recognition, EARTHVISION Workshop, 2017.
- R. Qin, “Automated 3D recovery from very high resolution multi-view images,” ASPRS 2017 Annual Conference, 2017.
https://engineering.purdue.edu/RVL/Database/SatStereo/index.html
Reference:
-
@article{patil:SatStereo:2019,
     title = {{A {N}ew {S}tereo {B}enchmarking {D}ataset for {S}atellite {I}mages}},
     author = {Sonali Patil, Bharath Comandur, Tanmay Prakash, and Avinash C. Kak},
     year = {2019},
     institution = {Purdue University,
                   School of Electrical and
                   Computer Engineering},
    journal = {arXiv},
}
http://www2.isprs.org/commissions/comm2/wg3/resources-and-links.html
http://www.cs.cmu.edu/~vmr/datasets/oakland_3d/cvpr09/doc/
http://www.cmm.mines-paristech.fr/~serna/rueMadameDataset.html
http://data.ign.fr/benchmarks/UrbanAnalysis/
https://registry.opendata.aws/dc-lidar-2015/
LiDAR point cloud data for Washington, DC is available for anyone to use on Amazon S3. This dataset, managed by the Office of the Chief Technology Officer (OCTO), through the direction of the District of Columbia GIS program, contains tiled point cloud data for the entire District along with associated metadata.
Classified Point Cloud Classes Each point within the point cloud has been classified according to the schema below.
- Class 1: Processed, but unclassified
- Class 2: Bare earth
- Class 7: Low noise
- Class 9: Water
- Class 10: Ignored ground
- Class 11: Withheld
- Class 17: Bridge decks
- Class 18: High noise
- A large set of point clouds with over four billion of labelled points.
- Ground truth, hand-labelled by professional assessors.
- A common evaluation tool providing the established intersection-union measure along with the full confusion matrix.
Reference:
- Hackel T, Savinov N, Ladicky L, et al. Semantic3d. net: A new large-scale point cloud classification benchmark[J]. arXiv preprint arXiv:1704.03847, 2017.
http://npm3d.fr/paris-lille-3d
The Paris-Lille-3D is a Benchmark on Point Cloud Classification. The data has been produced by a Mobile Laser System (MLS) in two different cities in France (Paris and Lille).
The Point Cloud has been labeled entirely by hand with 50 different classes to help the research community on automatic point cloud segmentation and classification algorithms.
Reference:
- Roynard X, Deschaud J E, Goulette F. Paris-Lille-3D: A Point Cloud Dataset for Urban Scene Segmentation and Classification[C]//Proceedings of the IEEE Conference on Computer Vision and Pattern Recognition Workshops. 2018: 2027-2030.
https://v-sense.scss.tcd.ie/DublinCity/
Urban Modelling Group at University College Dublin (UCD) captured major area of Dublin city centre (i.e. around 5.6 km^2 including partially covered areas) was scanned via an ALS device which was carried out by helicopter in 2015. However, the actual focused area was around 2 km^2 which contains the most densest LiDAR point cloud and imagery dataset. The flight altitude was mostly around 300m and the total journey was performed in 41 flight path strips.
Herein, around 260 million points (out of 1.4 billion) are labelled (figure 1). The selected area is within the most densely sampled part of the point cloud (i.e. 250 to 348 points/m^2) with full coverage by aerial images. This area (i.e. inside the red boxes) includes diverse types of historic and modern urban elements. Types of buildings include offices, shops, libraries, and residential houses. Those buildings are in the form of detached, semi-detached and terraced houses and belong to different eras (e.g. from 17th century rubrics building to the 21st century George’s Quay complex as a modern structure).
The result of the dataset and its applications are accepted and will be published at 30th British Machine Vision Conference (BMVC) on 9th until 12th of September 2019.
Reference:
https://github.com/201528014227051/RSICD_optimal
 RSICD is used for remote sensing image captioning task. more than ten thousands remote sensing images are collected from Google Earth, Baidu Map, MapABC, Tianditu. The images are fixed to 224X224 pixels with various resolutions. The total number of remote sensing images are 10921, with five sentences descriptions per image. To the best of our knowledge, this dataset is the largest dataset for remote sensing captioning. The sample images in the dataset are with high intra-class diversity and low inter-class dissimilarity. Thus, this dataset provides the researchers a data resource to advance the task of remote sensing captioning.
Reference:
- Lu X, Wang B, Zheng X, et al. Exploring Models and Data for Remote Sensing Image Caption Generation[J]. IEEE Transactions on Geoscience and Remote Sensing, 2017.
https://www.iarpa.gov/challenges/fmow.html
https://spacenetchallenge.github.io/datasets/fmow_summary.html
https://github.com/fmow
Intelligence analysts, policy makers, and first responders around the world rely on geospatial land use data to inform crucial decisions about global defense and humanitarian activities. Historically, analysts have manually identified and classified geospatial information by comparing and analyzing satellite images, but that process is time consuming and insufficient to support disaster response. The fMoW Challenge sought to foster breakthroughs in the automated analysis of overhead imagery by harnessing the collective power of the global data science and machine learning communities; empowering stakeholders to bolster their capabilities through computer vision automation. The challenge published one of the largest publicly available satellite-image datasets to date, with more than one million points of interest from around the world. The dataset also contains other elements such as temporal views, multispectral imagery, and satellite-specific metadata that researchers can exploit to build novel algorithms capable of classifying facility, building, and land use.
Reference:
- Gordon Christie, Neil Fendley, James Wilson, Ryan Mukherjee; The IEEE Conference on Computer Vision and Pattern Recognition (CVPR), 2018, pp. 6172-6180
IARPA has publicly released DigitalGlobe satellite imagery for the Creation of Operationally Realistic 3D Environment (CORE3D) program to enable performer teams to crowdsource manual labeling efforts and to promote public research that aligns well with the CORE3D program’s objectives. The data is available for download using this torrent file and is now also available on SpaceNet.
Catalog
aws s3 ls s3://spacenet-dataset/Hosted-Datasets/CORE3D-Public-Data/
The catalog contains the following packages:
- One WorldView-2 PAN and MSI image for Jacksonville, FL; Tampa, FL; Richmond, VA; and Omaha, NE
- Tiled WorldView-2 data sets including ground truth building labels for comparison with the USSOCOM Urban 3D Challenge
- 26 WorldView-3 PAN and MSI images over Jacksonville, FL
- 43 WorldView-3 PAN and MSI images over Omaha, NE
- 35 WorldView-3 PAN and MSI images over UCSD, CA
- 44 WorldView-2 PAN and MSI images over UCSD, CA
Please consider referencing the following when reporting results using this data:
Reference:
- M. Brown, H. Goldberg, K. Foster, A. Leichtman, S. Wang, S. Hagstrom, M. Bosch, and S. Almes, “Large-Scale Public Lidar and Satellite Image Data Set for Urban Semantic Labeling,” in Proc. SPIE Laser Radar Technology and Applications XXII, 2018.
https://mediatum.ub.tum.de/1436631
SEN1-2 is a dataset consisting of 282,384 pairs of corresponding synthetic aperture radar and optical image patches acquired by the Sentinel-1 and Sentinel-2 remote sensing satellites, respectively. The SEN1-2 dataset is published to foster deep learning research in SAR-optical data fusion. Several possible applications, such as SAR image colorization, SAR-optical image matching, and creation of artificial optical images from SAR input data.
Download: http://138.246.224.34/index.php/s/m1436631
The data server also offers downloads with FTP
The data server also offers downloads with rsync (password m1436631):
rsync rsync://m1436631@138.246.224.34/m1436631/
http://okutama-action.org/
an aerial view concurrent human action detection dataset. It contains 43 fully-annotated sequences of 12 human action classes. They used two UAV pilots to capture 22 different scenarios using 9 participants from a distance of 10-45 meters and camera angles of 45-90. The dataset is in the form of 30 FPS videos that provides 77365 images. They splitted the dataset into the training (33 videos) and testing samples (10 videos).
http://mafatchallenge.mod.gov.il/
https://competitions.codalab.org/competitions/19854
https://groups.google.com/a/mafatchallenge.com/forum/?hl=en#!forum/mafat-challenge-forum
https://grader.mafatchallenge.com/
The dataset consists of aerial imagery taken from diverse geographical locations, different times, resolutions, area coverage and image acquisition conditions (weather, sun direction, camera direction, etc). Image resolution varies between 5cm to 15cm GSD (Ground Sample Distance).
Few examples are presented below:

Participants are asked to classify objects in four granularity levels:
- Class - every object is categorized into one of the following major classes: 'Large Vehicles' or 'Small Vehicles'.
- Subclass - objects are categorized to subclasses according to their function or designation, for example: Cement mixer, Crane truck, Prime mover, etc. Each object should be assigned to a single subclass.
- Presence of features - objects are labeled according to their characteristics. For example: has a Ladder? is Wrecked? has a Sunroof? etc. Each object may be labeled with multiple different features
- Object perceived color - Objects are labeled with their (human) percieved color. For example: Blue, Red, Yellow etc. Each object includes a single color value.
Reference:
- Dahan E, Diskin T. COFGA: Classification Of Fine-Grained Features In Aerial Images[J]. arXiv preprint arXiv:1808.09001, 2018.
A Satellite Time Series Dataset for Crop Type Identification