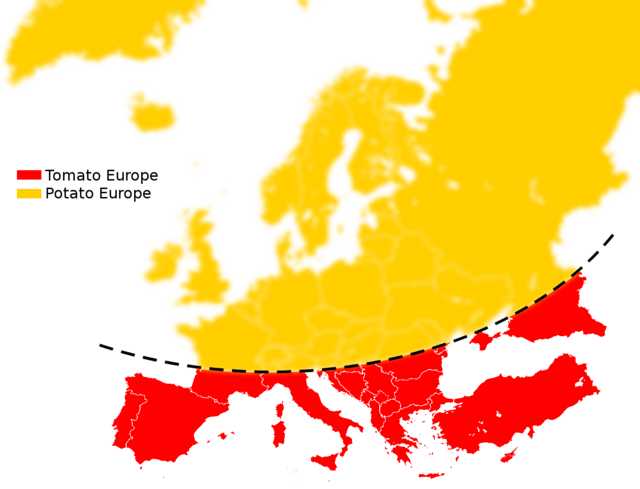
The project started as a desire to break this stereotype https://pbs.twimg.com/media/ELYNyjEWoAAbYcb.jpg i.e. to check how tomatoey or potatoey a (European) country is. In other words, the goal of this project is to break food based stereotypes.
But to analyse all 27 EU countries is a bit of a stretch. So this project focuses on two diametrically opposite countries. A typical stereotype is that Dutch are potato-eaters and Italians tomato eaters.
Data is scraped from a Dutch website (smulweb.nl) and an Italian website (giallozafferano.it) and then contrasted/analysed
The root directory contains all scripts. All code is written in R. Please read description below.
- script.R
This is the mother script ↑ and links to children scripts ↓. Ideally you can run this script (remove some one-time run commented code) and get same results
1.2. dependencies.R
All Libraries and Functions and functions for this project are loaded from here
1.3. scraperNL.R and scraperIT.R
These 2 scripts don't need to be run, they fetch data from the two source websites
1.4. fetchingIngredients.R
This is a hacky script to scrape x URLs and then wait. This had to be done because the Dutch website would close connections 1.5. analysis.R
Here the majority of data cleaning, analysis and plottting is performed - plots
This folder contains all generated plots - old
Can ignore this folder, some old/backup stuff - data
This folder contains two types of files. In principle, all files in this folder can be generated
4.1 .rds : these files are referred by the R script and contain R objects that are fetched or saved after some cleaning/analysis
4.2 .csv/.xlsx/.xlsm : these are some files where an R output is manually adjusted. Because either it was quicker or automation wasn't possible - TomatoPotato.pptx
This presentation was used at the eRum2020 virtual conference