This is the repository for our paper "SalienTime: User-driven Selection of Salient Time Steps for Large-Scale Geospatial Data Visualization", In Proceedings of the CHI Conference on Human Factors in Computing Systems (CHI'24), May 11-16, 2024, Honolulu, HI, USA.

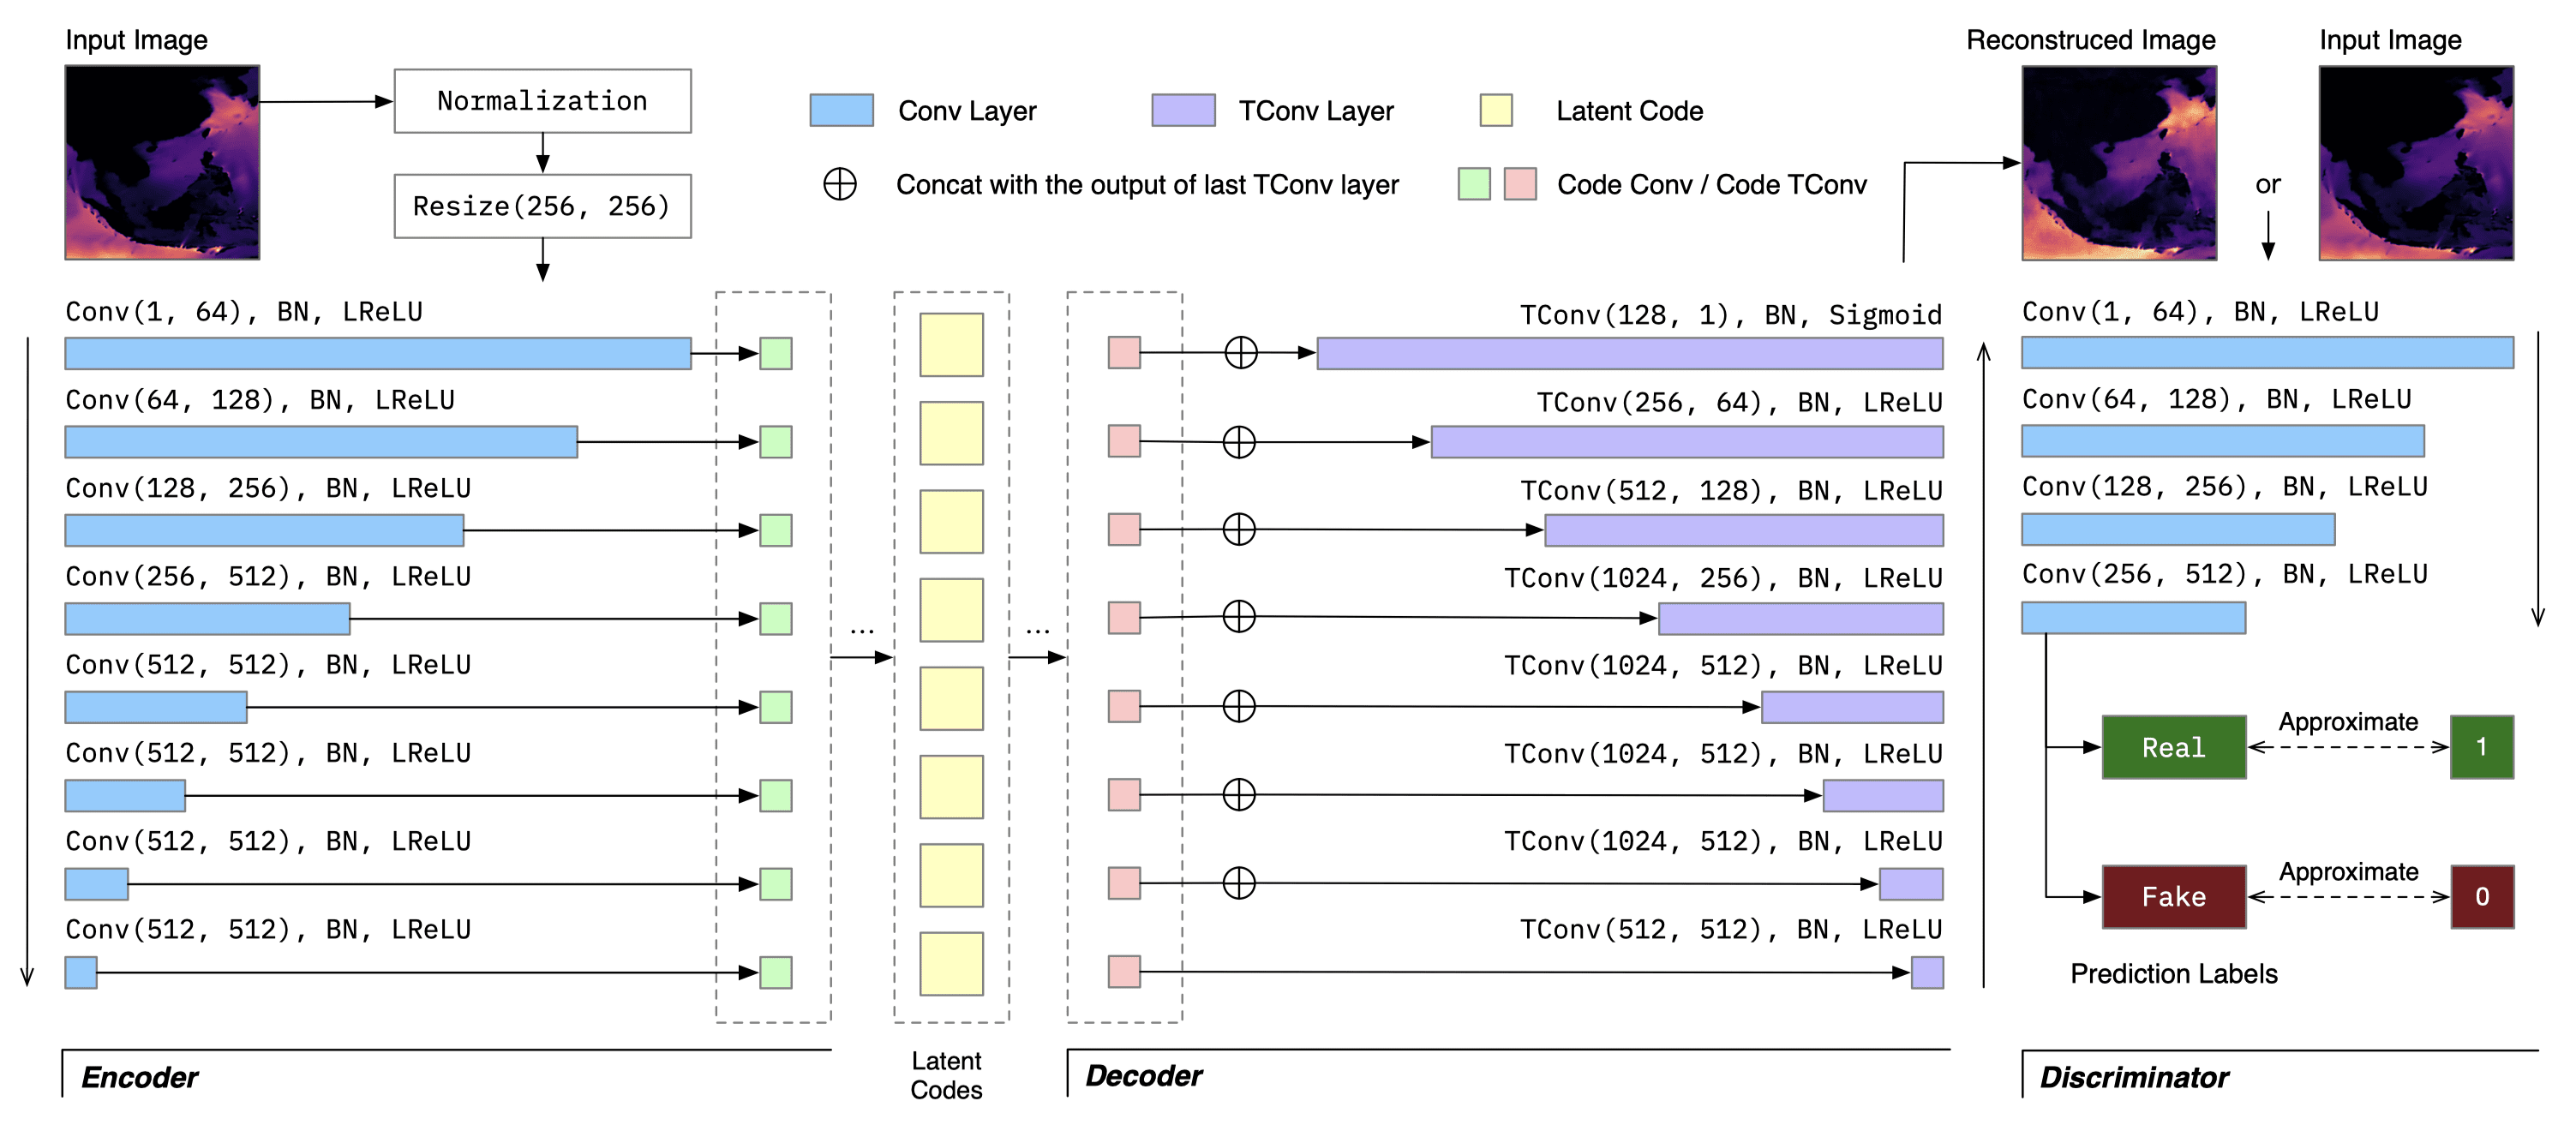
The voluminous nature of geospatial raster data often leads to blinded and cumbersome user expeirence in web-based data portals. Selecting a subset of timesteps for prioritized loading and visualization is highly desirable for elevating the users' tempoarl navigation experience. To select these salient frames, we first build a CNN-based Autoencoder to learn meaningful latent codes for each time steps, and select salient frames with the goal of maximizing the total amount information carried in the selected frames using DP. The cost function incorporates structural variation, statistical variation, and distance penealty to avoid selecting consecutive frames, with user-specified priorities to adapt to different data exploration tasks.
Required dependency are listed in requirements.txt. You may first install system-dependent packages like PyTorch, GDAL and tsnecuda using conda, and then pip install -r requirements.txt.
You can download the datasets here and the model checkpoints here. Please extract datasets.zip to the dataset folder and checkpoints.zip to the checkpoint folder.
To train your own model, you should first modify the parameters in config.yml, especially data.data_dir which specifies the directory of the training data. Then, you can train your own model by running:
python train.pyFirst, build the binary select_k.so for selecting salient time steps. We implement the selection using C++ as it provides much better performance (5 - 10x faster) compared with Python:
cd cp
cmake .
cmake --build .
Then, running the server (default port: 6008) with the following command:
python app.pyThe server requires about 10GB of memory as we pre-load datasets into the memory for faster access. You can test salient frame selection using the following command:
# Request loading the dataset and generate latent codes.
curl --request POST \
  --url http://127.0.0.1:6008/load/global-hs \
  --header 'Accept: application/json' \
  --header 'Content-Type: application/json'
}

# Perform salient frame selection
curl --request POST \
  --url http://127.0.0.1:6008/findframe \
  --header 'Accept: application/json' \
  --header 'Content-Type: application/json' \
  --data '{
  "dataset": "global-hs",
  "start": 0,
  "end": 100,
  "k": 10,
  "alpha": 1,
  "beta": 0,
  "agg": "max"
}'
Here k is the number of time steps to select from a given range [start, end] (including the end), alpha and beta are the weight for structural variation and statistical variation, respectively. agg is the aggregation operation used for the statistical variation.
For more detailed usage of API endpoints and parameters, please refer to the Flask API document available at http://127.0.0.1:6008/docs.
You can use eval_salientime.py to automatically test the performance of selected salient frames. The script will run salient frame selection with different ks, compute the reconstruction quality compared with even selection, and generate plots used in our paper. The available parameters are:
-h, --help            show this help message and exit
--name NAME           Name of the dataset
--tiff_glob TIFF_GLOB
                      glob pattern specifying the geotiff folder.
--resize_ratio RESIZE_RATIO
                      Resize ratio [0, 1] to make computation faster.
--checkpoint CHECKPOINT
                      Checkpoint name.
--frange FRANGE FRANGE FRANGE
                      Range of the frame index. [start, end, step]
--krange KRANGE KRANGE KRANGE
                      Range of the k. [start, end, step]
--cmap CMAP           Colormap name to use.
--outk OUTK           The k used for generating colorized raster fiiles.
--arck ARCK           The k for arc-based selection (baseline method).
--arcparams ARCPARAMS
                      Parameters for arc-based selection. [alpha, theta, epsilon, delta]
--agg AGG             Aggregation method for statistical variation. max, min or avg.
--gamma GAMMA         Controling the weight of structural cost and statistical cost.
--unit UNIT           Unit of the data, will be displayed in the generated plots.
--cache CACHE         Whether to use the cache folder.
--out_dir OUT_DIR     Output working directory.
--reverse REVERSE     If reverse the colormap.
--eval_process EVAL_PROCESS
                      Number of processes for evaluation.
You can also specify the parameters by changing the config variable in the code directly.
Upon finish, you can find a new directorey under the result folder, where all the metrics and plots are stored:
.
├── aggregation_max.pdf
├── arc
│   └── arc_compare.csv
├── colorbar.pdf
├── colorizedk
│   └── ...(multiple colorized raster files).png
├── latent_space.pdf
├── matrix
│   ├── matrix_alpha.pdf
│   ├── matrix_beta.pdf
│   ├── matrix_gamma.pdf
│   └── matrix_mix.pdf
├── metric_beta.csv
├── metric_beta.pkl
├── metric_k.csv
├── metric_k.pkl
├── metric_psnr.pdf
├── metric_rmse.pdf
├── metric_ssim.pdf
├── selection_beta.pdf
└── selection_k.pdf
The datasets are placed under the datasets folder where each valid datasets contain the following files:
- png: gray scale image files for each timestep (uint8)
- tiff: original tiff files for each timestep (float64)
- float32.pkl: numpy array of shape [num_timestep, h, w] (float32)
- uint8.npy: numpoy array of shape [num_timestep, h, w] (uint8)
- <dataset_name>.json: meta data of the dataset, containing units, geo boundary, etc.
Here we provide two datasets: global-hs and rdi. global-hs is the world-wide significant wave height dataset from 2017 to 2018, generated by WAVEWATCH III. rdi is the Red Tide Index dataset from 2020 to 2021.
@inproceedings{chen2024salientime,
  title={SalienTime: User-driven Selection of Salient Time Steps for Large-Scale Geospatial Data Visualization},
  author={Chen, Juntong and Huang, Haiwen and Ye, Huayuan and Peng Zhong and Li, Chenhui and Wang, Changbo},
  booktitle={Proceedings of the 2024 CHI Conference on Human Factors in Computing Systems},
  year={2024}
}
Contact: bill.chen [at] live.com