![]()

Profiling R computations is supported by Rprof and profvis. These measure memory consumption and function execution counts and timings. In workflow design we are also interested in CPU load, disk I/O, and network traffic. There is no standard portable approach to measuring these. In this package, we focus on linux systems measurement with the collectl suite of tools.
Our objective in this workspace is demonstration of instrumentation of bioinformatic tasks. By "instrumentation" we mean the definition and use of tools that measure computational resource consumption: memory, disk, CPU, network traffic.
(On AnVIL, we do not know how to identify the network device and data on network traffic are not obtained as of 1/1/2021.)
This Dashboard Description discusses details of an example using salmon to carry out quantification of an RNA-seq experiment.
This workspace was initialized using AnVILPublish. The runtime/cloud environment used as of 2020-01-04 is
dockerhub vjcitn/instr:0.0.3
The FASTQ files underlying the "airway" RNA-seq workflow were collected using commands like
gsutil -u landmarkanvil2 ls  gs://sra-pub-run-3/SRR1039512/SRR1039512.1
gsutil -u landmarkanvil2 cp  gs://sra-pub-run-4/SRR1039513/SRR1039513.1 .
gsutil -u landmarkanvil2 cp  gs://sra-pub-run-4/SRR1039516/SRR1039516.1 .
gsutil -u landmarkanvil2 cp  gs://sra-pub-run-2/SRR1039517/SRR1039517.1 .
gsutil -u landmarkanvil2 cp  gs://sra-pub-run-2/SRR1039520/SRR1039520.1 .
gsutil -u landmarkanvil2 cp  gs://sra-pub-run-3/SRR1039521/SRR1039521.1 .
A public bucket with the extracted fastq was then produced via
fastq-dump --split-3 *512.1 &
fastq-dump --split-3 *513.1 &
fastq-dump --split-3 *516.1 &
fastq-dump --split-3 *517.1 &
fastq-dump --split-3 *520.1 &
fastq-dump --split-3 *521.1 &
gzip *fastq
gsutil ls gs://bioc-airway-fastq
gsutil cp SRR1039508.1_2.fastq.gz gs://bioc-airway-fastq/
Our aim is to analyze the resource consumption in processing this sort of data with R using Rcollectl. We'll describe how to run salmon to generate quantifications,and we will attempt to give estimates for processing various volumes of data by various approaches.
We installed snakemake with pip3 and salmon via
wget https://github.com/COMBINE-lab/salmon/releases/download/v1.4.0/salmon-1.4.0_linux_x86_64.tar.gz
We obtained GENCODE transcript sequences:
wget ftp://ftp.ebi.ac.uk/pub/databases/gencode/Gencode_human/release_36/gencode.v36.transcripts.fa.gz
And built the index gencode.v36_salmon_1.4.0 via
salmon index --gencode -t gencode.v36.transcripts.fa.gz -i gencode.v36_salmon_1.4.0
For a single sample (paired-end) we have a snakemake file:
rstudio@saturn-1f2f18e5-4182-40c0-8449-1f301b5c3b03:~$ cat snakemake_one
DATASETS = ["SRR1039508.1"]

SALMON = "/home/rstudio/bin/salmon"

rule all:
  input: expand("quants/{dataset}/quant.sf", dataset=DATASETS)

rule salmon_quant:
    input:
        r1 = "fastq/{sample}_1.fastq.gz",
        r2 = "fastq/{sample}_2.fastq.gz",
        index = "/home/rstudio/gencode.v36_salmon_1.4.0"
    output:
        "quants/{sample}/quant.sf"
    params:
        dir = "quants/{sample}"
    shell:
        "{SALMON} quant -i {input.index} -l A -p 6 --validateMappings \
         --gcBias --numGibbsSamples 20 -o {params.dir} \
         -1 {input.r1} -2 {input.r2}"
When used with
snakemake -j1 --snakefile snakemake_one
it takes 6 minutes to produce a folder quants with content
└── SRR1039508.1
    ├── aux_info
    │   ├── ambig_info.tsv
    │   ├── bootstrap
    │   │   ├── bootstraps.gz
    │   │   └── names.tsv.gz
    │   ├── expected_bias.gz
    │   ├── exp_gc.gz
    │   ├── fld.gz
    │   ├── meta_info.json
    │   ├── observed_bias_3p.gz
    │   ├── observed_bias.gz
    │   └── obs_gc.gz
    ├── cmd_info.json
    ├── lib_format_counts.json
    ├── libParams
    │   └── flenDist.txt
    ├── logs
    │   └── salmon_quant.log
    └── quant.sf
We use the Rcollectl package (which must be installed from github.com/vjcitn/Rcollectl) to monitor resource consumption while the snakemake process is running.
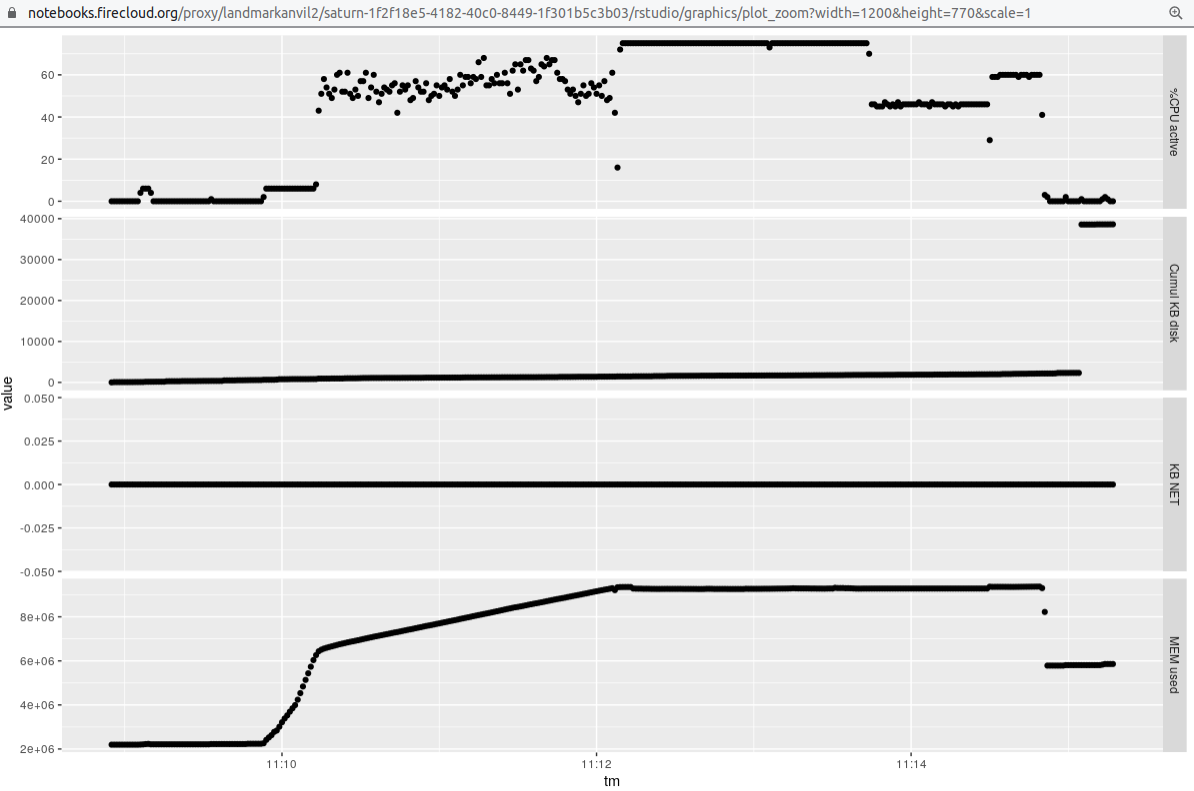
Here is a display of the resource consumption for the single (paired-end) sample:
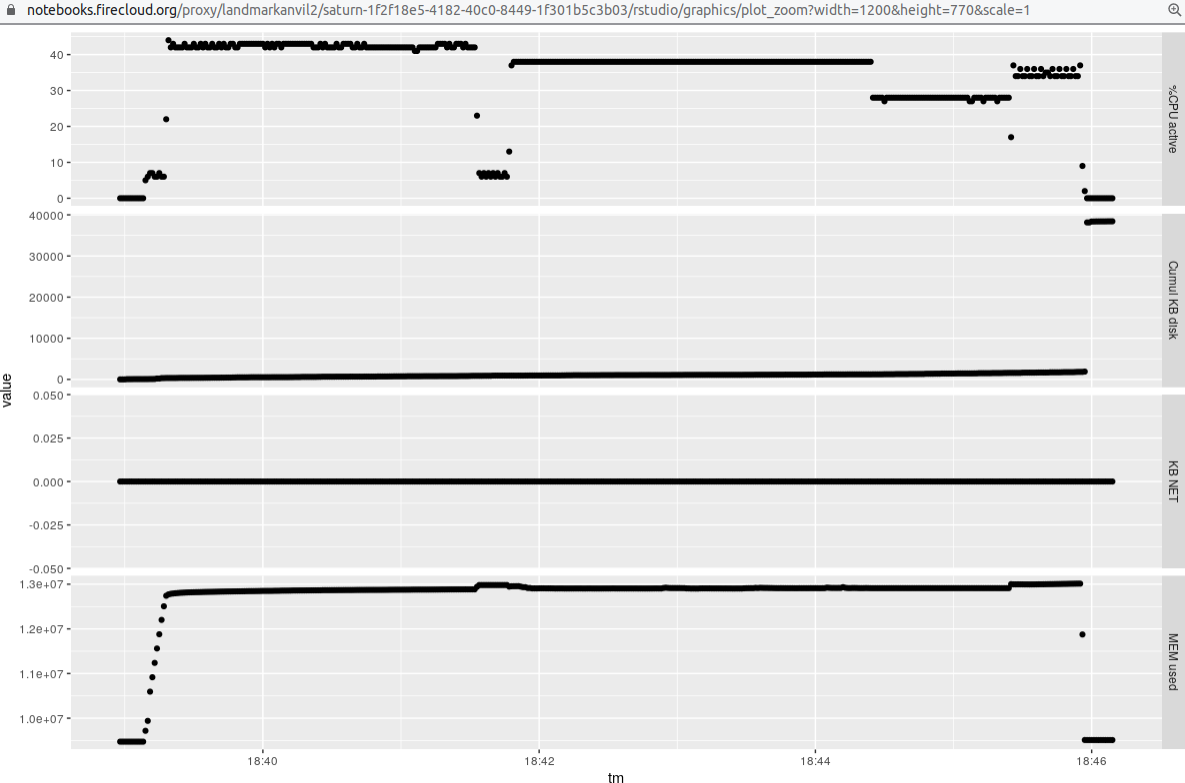
That run uses a setting of -p 6 for salmon quant, which allows the algorithm to use 6 threads.
We
used a 16 core machine, and raised the value of -p to 12 to obtain the following profile:
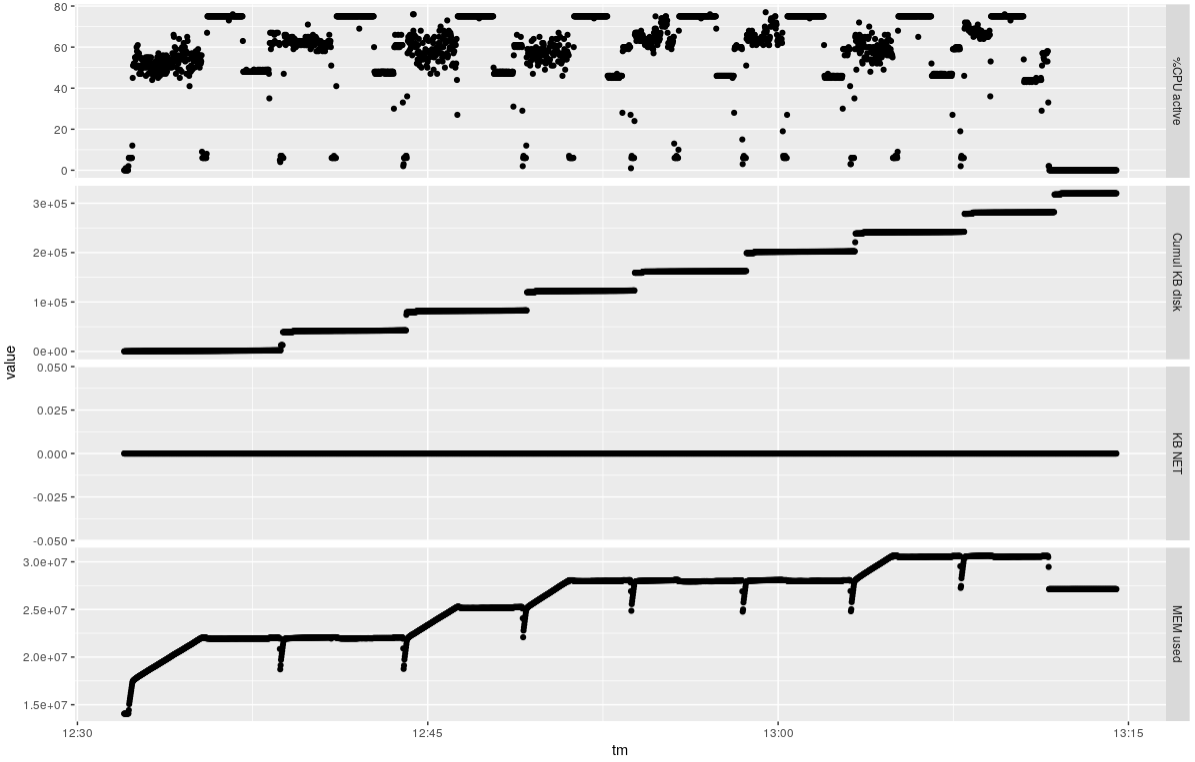
It takes about 40 minutes to do the eight samples, using about 80% of the available CPUs and about 16 GB RAM overall.
Finally, we obtain some data to compare thread-based parallelism to process parallelism. We'll reduce the number of threads per sample, but run 4 samples at once via snakemake -j argument.
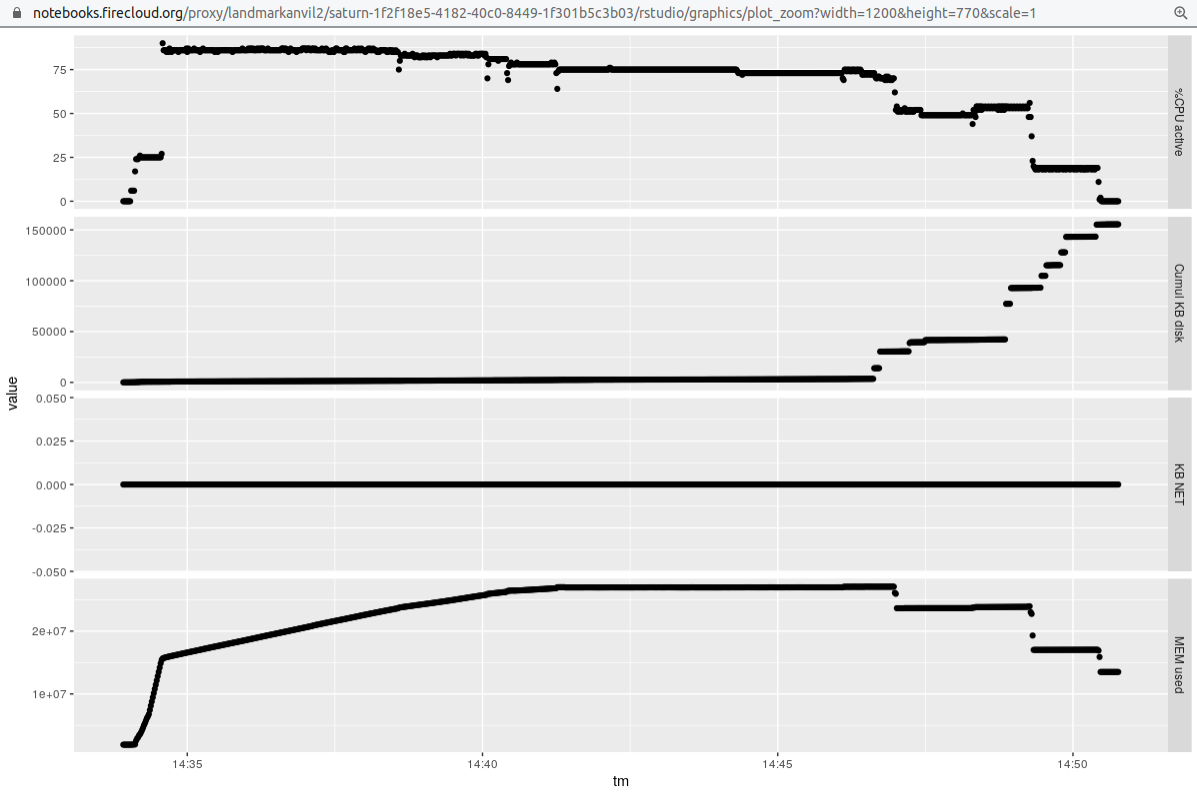
It seems the throughput is a bit better here, but we should check the comparability of results of the different approaches before declaring this.
Rcollectl can be used to obtain useful profiling information on AnVIL interactive work. We saw that the salmon quantification could be tuned to consume 80-90% of available CPUs. The RAM requirements and disk consumption are measurable. It does not seem possible to decouple the NCPU from the RAM elements in a fine-grained way in AnVIL interactive cloud environments. For 16 cores we could choose between 14.4 and 64 GB RAM. 64 GB seems too much for the task we are doing.
Additional work of interest: snakemake is used only because a working snakefile was published. We would like to be able to conduct these exercises in a more Bioconductor-native way. Specifically, we should have an object representing the read data in a self-describing way, and use BiocParallel to manage the execution approach.
Furthermore, as we define the self-describing representation of the read data in Bioconductor, we should consider how it maps to the AnVIL/Terra-native structures related to the workspace data tables, and DRS.