
(Pronounced "churro.")
Qurro visualizes the output from a tool like songbird or DEICODE. It facilitates viewing a plot of feature rankings alongside a plot showing the log ratios of selected features' abundances within samples.
Qurro can be used standalone (as a Python 3 script that generates a
folder containing a HTML/JS/CSS visualization) or as a
QIIME 2 plugin (that generates a QZV file that can be
visualized at view.qiime2.org or by using
qiime tools view).
Qurro should work with most modern web browsers. Firefox or Chrome are recommended.
Qurro is still being developed, so backwards-incompatible changes might occur. If you have any questions, feel free to contact the development team at mfedarko@ucsd.edu.
See the Qurro website for a list of interactive demos using real datasets.
This visualization (which uses data from this study, with ranks generated by songbird) can be viewed online here.
You can install Qurro using pip:
pip install numpy
pip install qurro
A python version of at least 3.5 is required to use Qurro.
Certain characters in column names in the the sample metadata, feature metadata, and feature differentials (if passed) will be replaced with similar characters:
| Old Character(s) | New Character |
|---|---|
. |
: |
] |
) |
[ |
( |
', ", or \ |
| |
This is due to some downstream issues with handling these sorts of characters in field names. See this issue for context.
If you have a GNPS feature metadata file (where each row in the file has a
parent mass and RTConsensus column), you can pass in the -gnps
(--assume-gnps-feature-metadata) command-line argument to Qurro's
standalone script to make Qurro understand the metadata file. Please
note that this functionality is experimental; furthermore, it is not yet
available in the QIIME 2 plugin version of Qurro.
Examples of using Qurro (both inside and outside of QIIME 2) are available in Qurro's example Jupyter notebooks, which are located here:
deicode_example.ipynbdemonstrates using DEICODE and then using Qurro to visualize DEICODE's output.songbird_example.ipynbdemonstrates using songbird and then using Qurro to visualize songbird's output.
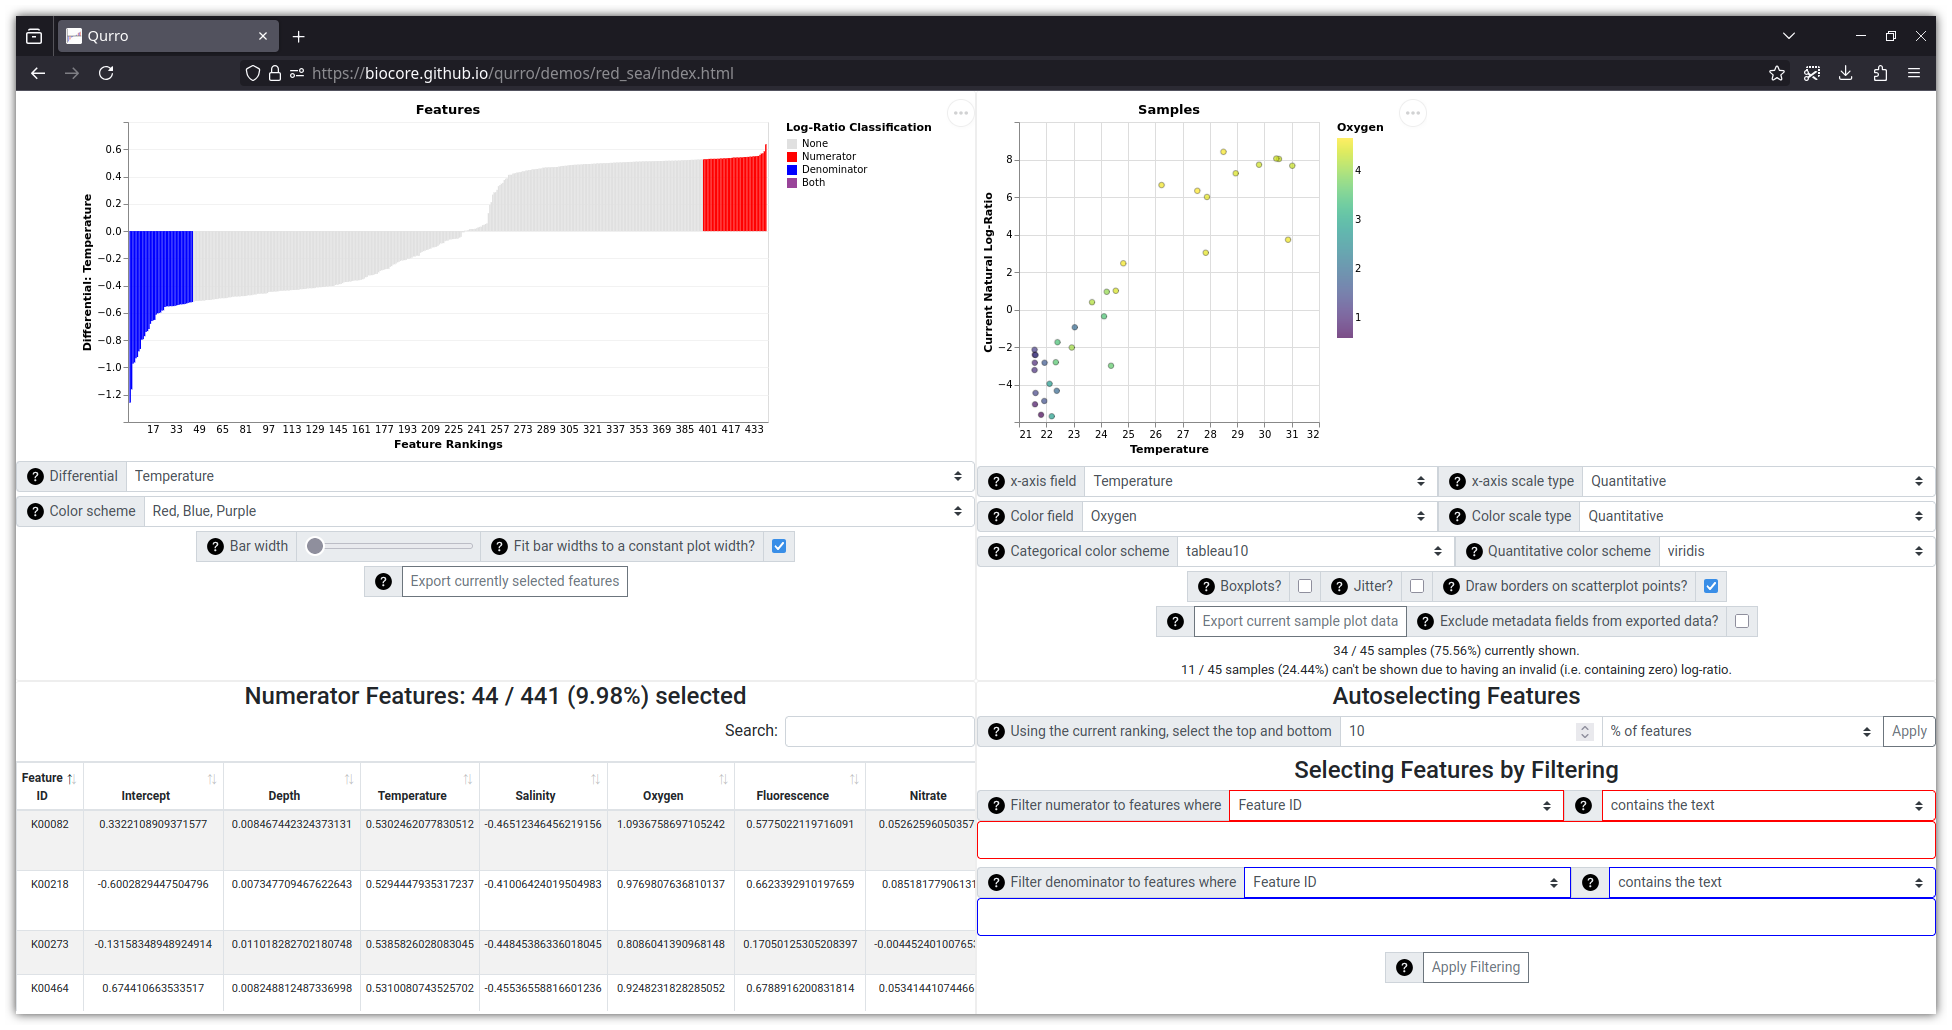
The two plots (one of feature rankings, and one of samples' log ratios) in a Qurro visualization are linked [1]: when a change is made to the selected features in a log ratio, both the rank plot and sample plot are accordingly modified.
To elaborate on that: clicking on two features in the rank plot sets a new numerator feature (determined from the first-clicked feature) and a new denominator feature (determined from the second-clicked feature) for the abundance log ratios in the sample plot.
You can also run textual queries over the various feature IDs in order to construct more complicated log ratios (e.g. "the log ratio of the combined abundances of all features that contain the text 'X' over the combined abundances of all features that contain the text 'Y'"). Although this method doesn't require you to manually select features on the rank plot, the rank plot is still updated to indicate the features used in the log ratios.
A manuscript describing Qurro is in preparation. In the meantime, you can cite the DOI of Qurro's source code (provided by Zenodo). See this link for citation instructions.
Code files for the following projects are distributed within
qurro/support_file/vendor/.
See the dependency_licenses/ directory for copies of these software projects'
licenses (each of which includes a respective copyright notice).
- Vega
- Vega-Lite
- Vega-Embed
- RequireJS
- reset
- Note that
resetis released under the public domain, so it doesn't have a "license." In any case, thank you to Eric Meyer for providing this resource!
- Note that
The following software projects are required for Qurro's python code to function, although they are not distributed with Qurro (and are instead installed alongside Qurro).
For python testing/style checking, Qurro uses pytest, pytest-cov, flake8, and black. You'll also need to have QIIME 2 installed to run most of the python tests (the exact QIIME 2 version shouldn't matter too much).
For JavaScript testing/style checking, Qurro uses Mocha, Chai, mocha-headless-chrome, nyc, jshint, and prettier.
Qurro also uses Travis-CI and Codecov.
The test data located in qurro/tests/input/byrd/ are from
this repository.
These data, in turn, originate from Byrd et al.'s 2017 study on atopic
dermatitis [2].
The test data located in qurro/tests/input/sleep_apnea/
(and in example_notebooks/DEICODE_sleep_apnea/input/)
are from this Qiita study,
which is associated with Tripathi et al.'s 2018 study on sleep apnea [4].
The test data located in qurro/tests/input/moving_pictures/
are from the QIIME 2 moving pictures tutorial.
The ordination.qza file in this folder was computed based on the
DEICODE moving pictures tutorial.
These data (sans the DEICODE ordination) are associated with Caporaso et al. 2011 [5].
Lastly, the data located in qurro/tests/input/red_sea
(and in example_notebooks/songbird_red_sea/input/, and shown in the
screenshot above) were taken from songbird's GitHub repository in its
data/redsea/
folder, and are associated with
this paper [3].
Qurro's logo was created using the Lalezar font. Also, shout out to this gist for showing how to center images in GitHub markdown files (which is more of a hassle than it sounds).
The design of Qurro was strongly inspired by EMPeror and q2-emperor, along with DEICODE. A big shoutout to Yoshiki Vázquez-Baeza for his help in planning this project, as well as to Cameron Martino for a ton of work on getting the code in a distributable state (and making it work with QIIME 2). Thanks also to Jamie Morton, who wrote the original code for producing rank and sample plots from which this is derived.
And thanks to a bunch of the Knight Lab for helping name the tool :)
[1] Becker, R. A. & Cleveland, W. S. (1987). Brushing scatterplots. Technometrics, 29(2), 127-142. (Section 4.1 in particular talks about linking visualizations.)
[2] Byrd, A. L., Deming, C., Cassidy, S. K., Harrison, O. J., Ng, W. I., Conlan, S., ... & NISC Comparative Sequencing Program. (2017). Staphylococcus aureus and Staphylococcus epidermidis strain diversity underlying pediatric atopic dermatitis. Science translational medicine, 9(397), eaal4651.
[3] Thompson, L. R., Williams, G. J., Haroon, M. F., Shibl, A., Larsen, P., Shorenstein, J., ... & Stingl, U. (2017). Metagenomic covariation along densely sampled environmental gradients in the Red Sea. The ISME journal, 11(1), 138.
[4] Tripathi, A., Melnik, A. V., Xue, J., Poulsen, O., Meehan, M. J., Humphrey, G., ... & Haddad, G. (2018). Intermittent hypoxia and hypercapnia, a hallmark of obstructive sleep apnea, alters the gut microbiome and metabolome. mSystems, 3(3), e00020-18.
[5] Caporaso, J. G., Lauber, C. L., Costello, E. K., Berg-Lyons, D., Gonzalez, A., Stombaugh, J., ... & Gordon, J. I. (2011). Moving pictures of the human microbiome. Genome biology, 12(5), R50.
This tool is licensed under the BSD 3-clause license. Our particular version of the license is based on scikit-bio's license.