This is a Grafana datasource for fetching Metrics, Events & logs from Helix Monitor, Helix Remediate & Helix Optimize products
Grafana 7.3.1+ is required.
BMC Helix v21.02+ license/subscription is required
- Supports Lucene queries to fetch Events & Logs
- Supports Promql & Metricql to fetch Metrics data
- Utilizes BMC Helix REST API's
- Secured authentication via access key and secret key
This datasource uses the Instana REST API to query the underlying data services.
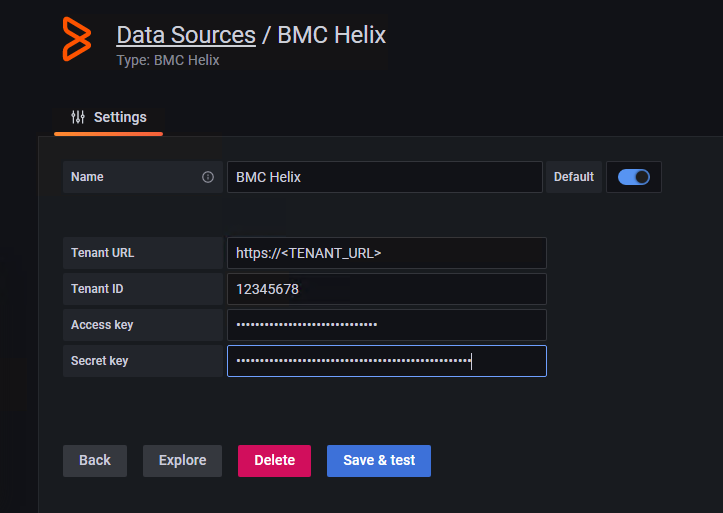
First of all you will need to generate an Access key & Secret key in BMC Helix portal (Keys)
Configure Retrived values as shown below
The following query types are available:
-
CloudSecurity
Use this query type to fetch compliance data of the devices in your environment.
-
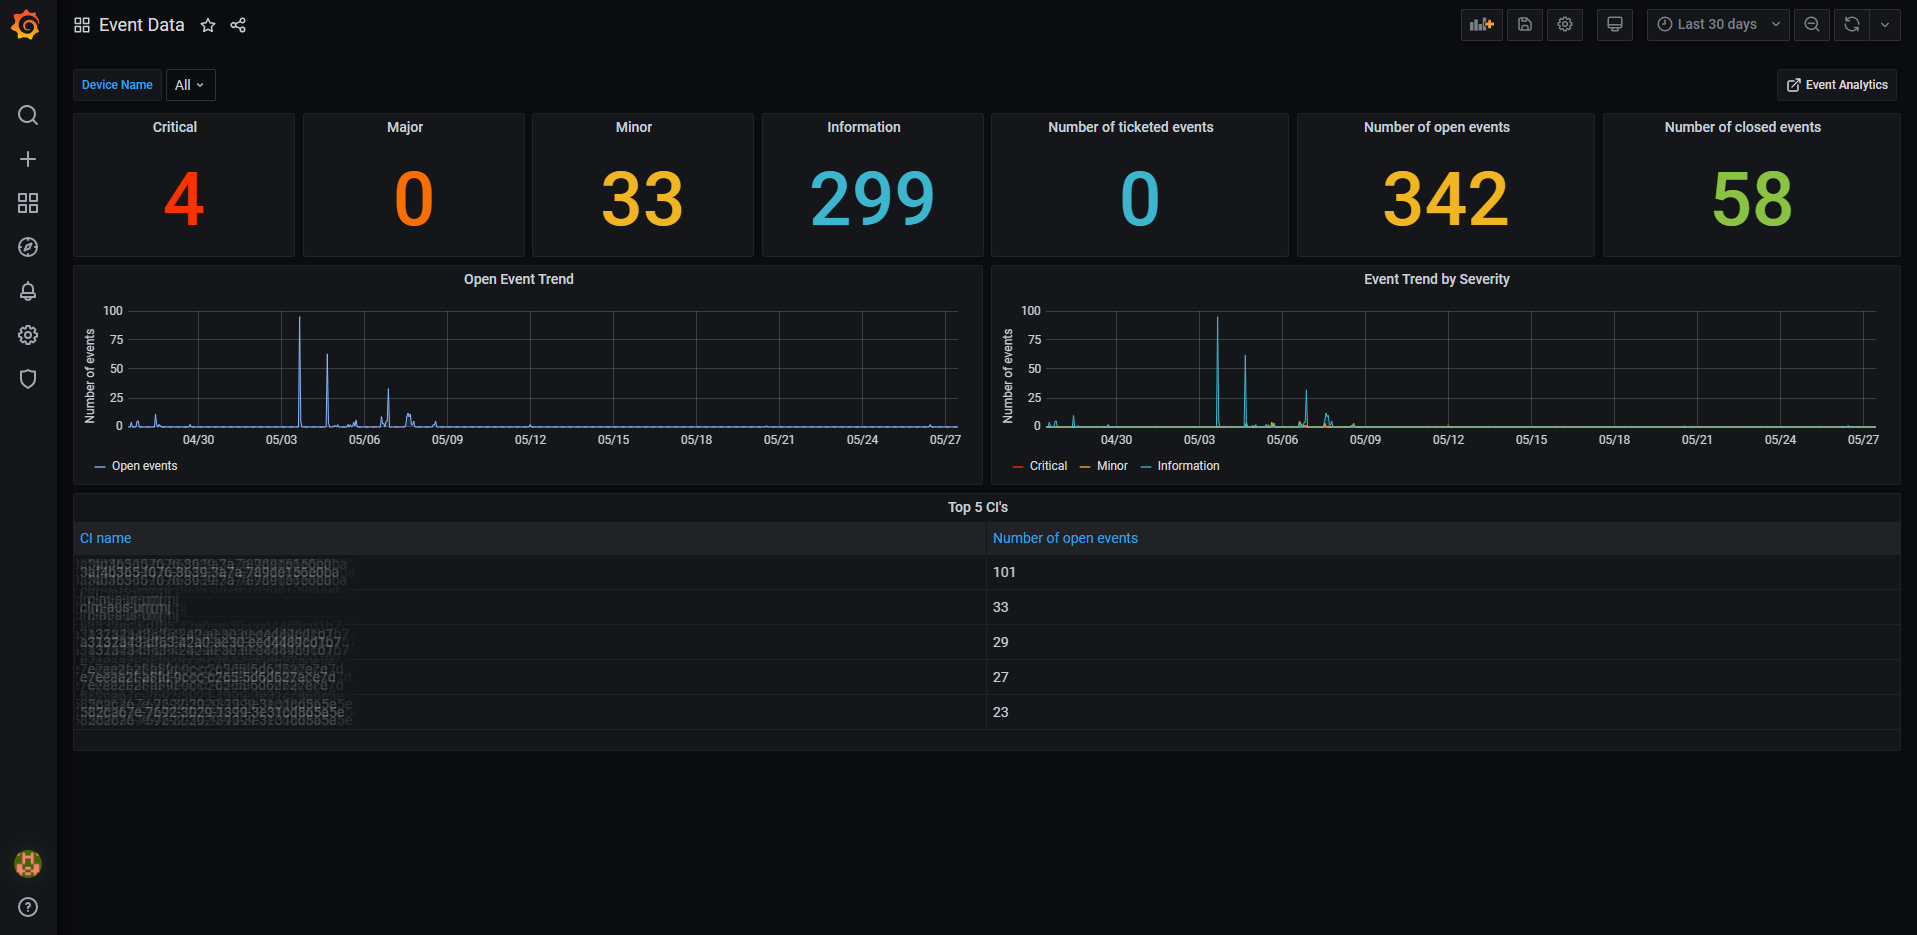
Events
Use this query type to fetch event data on the devices in your environment.
-
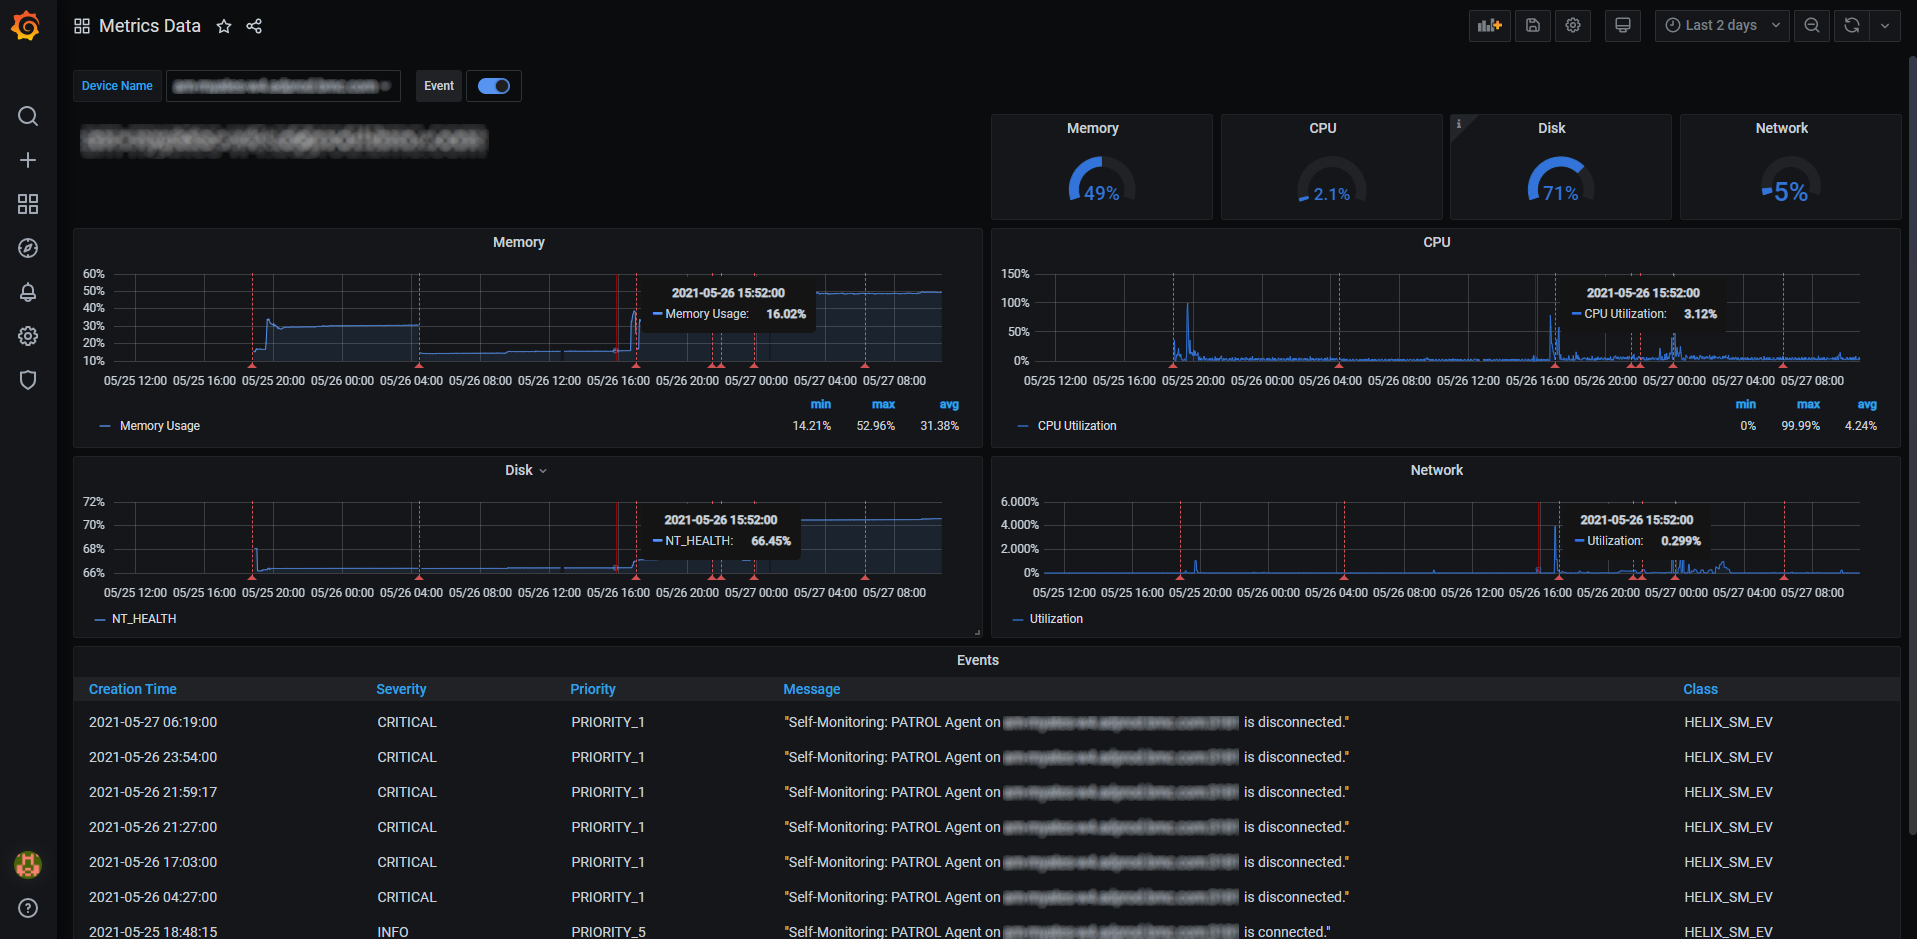
Metric
Use this query type to fetch the performance metrics data of the devices in your environment.
-
Log
Use this query type to fetch the log data from BMC Helix Log Analytics in your environment.
This section describes the each query editor.
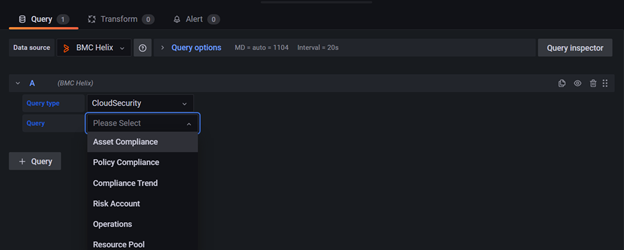
The following image displays the CloudSecurity query type:
This query type requires the following data:
| Field | Description |
|---|---|
| Query Type | Use this field to select the query type |
| Query | Use one of the following queries to build a panel. The options for each query type are different Asset Compliance, Policy Compliance , Compliance Trend, Risk Account, Operations, Resource Pool |
The following image displays the Events query type:
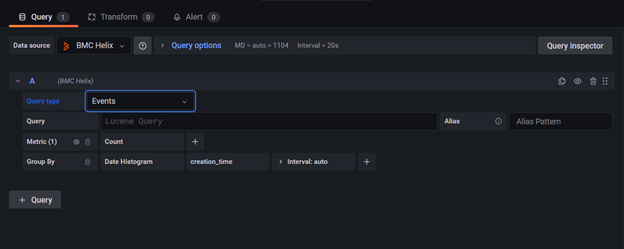
This query type requires the following data:
| Field | Description |
|---|---|
| Query Type | Use this field to select the query type |
| Query | Use a Lucene query syntax here, and it also supports typeahead |
| Metric | Click this field to select a metric for the query. For example, Average, Min, Max, and so on |
| Group by | Select a clause to group your data in the panel. |
The following image displays the Metric query type:
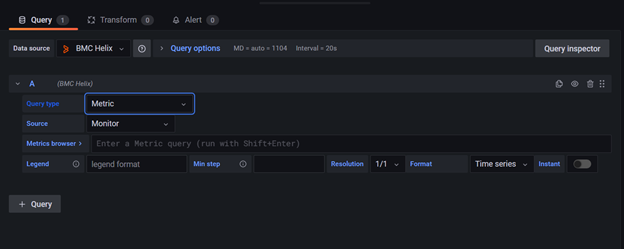
| Field | Description |
|---|---|
| Query Type | Use this field to select the query type |
| Metrics | Add a metrics query to this field. You can also form your metric query through query builder. Click the Metrics Browser field to access the query builder. |
| Legend | Add a legend to appear in the panel. You can use a variable here. For example, the value of the {{hostname}} variable is replaced with the host name in the panel. |
| Min step | Add a threshold for a lower limit of the Prometheus query. This setting is absolute, and cannot be changed by the value in the Resolution field. |
| Resolution | Sets the parameter for each pixel to correspond to one data point of a Prometheus range query. Use lower resolutions for better performance. |
| Format | Select one of the following formats for the panel: Time Series , Table , Heatmap |
| Instant | Use this radio button to return only the latest value for the requested time series. Instant queries return results faster than the normal range queries. |