Skip to content
New issue

Have a question about this project? Sign up for a free GitHub account to open an issue and contact its maintainers and the community.

By clicking “Sign up for GitHub”, you agree to our terms of service and privacy statement. We’ll occasionally send you account related emails.

Already on GitHub? Sign in to your account

[BUG] FactorRange updates not processed correctly #9151

Open
harmbuisman opened this issue Aug 9, 2019 · 4 comments
Open

[BUG] FactorRange updates not processed correctly #9151

harmbuisman opened this issue Aug 9, 2019 · 4 comments

Comments

@harmbuisman
Copy link
Contributor

harmbuisman commented Aug 9, 2019

ALL software version info (bokeh, python, notebook, OS, browser, any other relevant packages)

bokeh.version: 1.3.0
python: 3.7.3
OS: Windows 10
browser: all

Description of expected behavior and the observed behavior

I am struggling to get the categorical bar chart for dynamic definitions of the factors working and the problem is related to the behavior of the xrange of the chart.

There are two ways to update the x_range of a chart:
1: p.x_range = FactorRange(factors=list(df['factors'].values))
2: p.x_range.factors = list(df['factors'].values)

In the first case a new x_range is created from a new FactorRange instance, in the second case only the factors are set.

For my specific implementation for some reason the first option does not work. I am left with an empty plot (no errors, not in Python, not in JS):
image

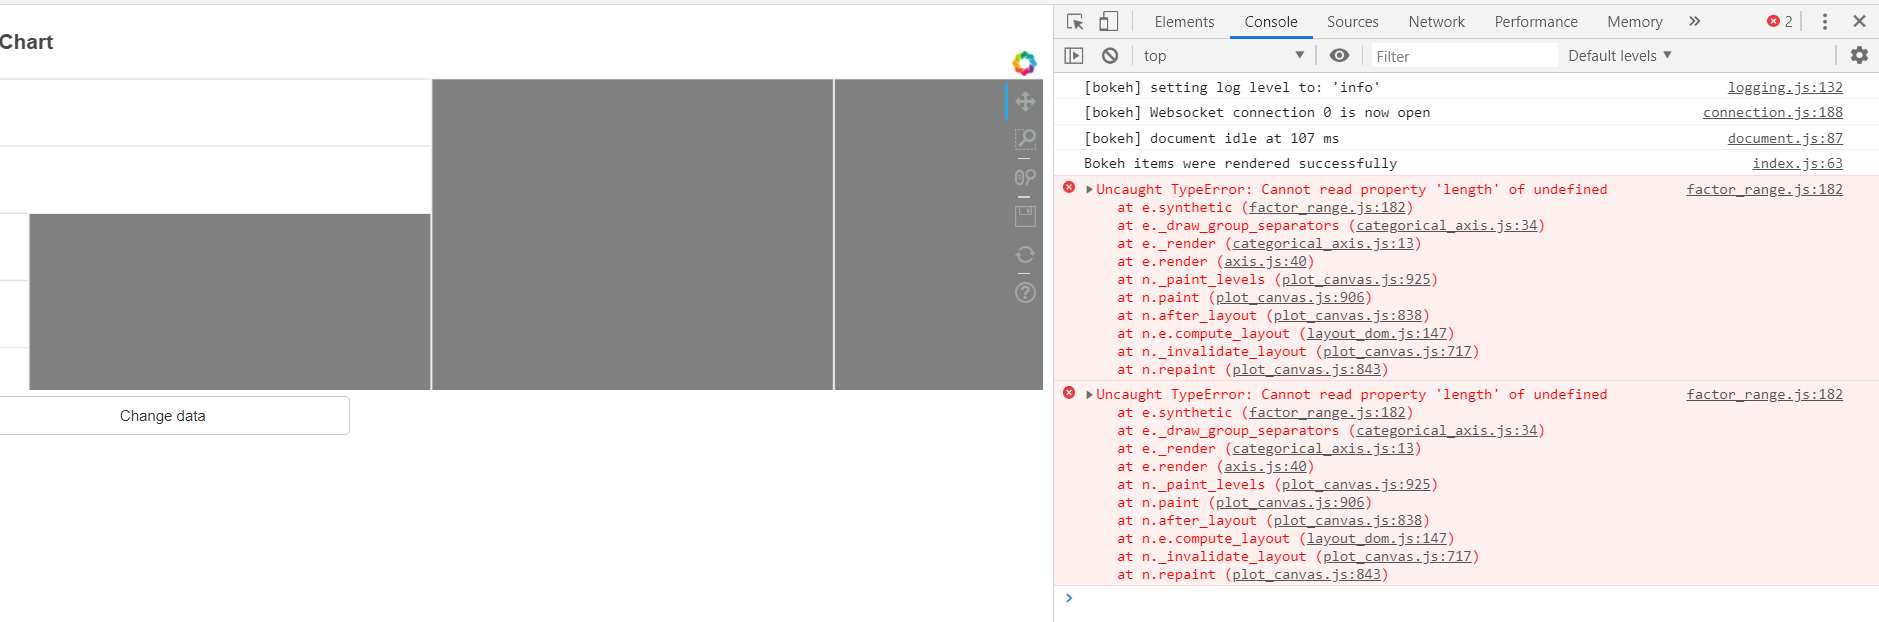
If I use the second option (.x_range_.factors) the plot is populated partly as expected, but I get errors in the JS console and the sizing seems incorrect:
image
image

After doing some more actions I also see this error (though I guess based on the statements this is a slickgrid issue, not a chart issue, so possibly irrelevant):
image

I tried to reproduce both behaviours, but the first behavior I cannot reproduce outside of my app. (Any pointers for what could cause this are welcome).
The second behaviour I can reproduce with the example below. How can I workaround this issue? What is not handled if I just set .x_range.factors?

My expectation:

  • just setting factors produces a correct output without errors on the JS side
  • if possible some more console (JS or Python) output when there is data and definitions, but there is no plot

Complete, minimal, self-contained example code that reproduces the issue

from bokeh.plotting import curdoc, figure
import numpy as np
import pandas as pd
from bokeh.models import ColumnDataSource, Button, FactorRange
from bokeh.palettes import Spectral6
from bokeh.transform import factor_cmap
from bokeh.models.glyphs import VBar

df = pd.DataFrame(data=[['2000', 1, ('2000', '1')],['2001',2, ('2001', '2')]],
                    columns=['colors', 'value', 'factors'])

groups = df['colors'].unique()
index_cmap = factor_cmap('factors', palette=Spectral6, factors=groups, end=1)

factor_range = FactorRange(factors=list(df['factors'].values))
p = figure(plot_width=800, plot_height=300, title="Chart",
            x_range=factor_range,
            match_aspect=False, sizing_mode="stretch_width",
            name='chart')

vbar = VBar(x='factors', top='value', width=1,
                    line_color="white", fill_color=index_cmap)

p.y_range.start = 0
p.x_range.range_padding = 0.05
p.xgrid.grid_line_color = None
p.xaxis.axis_label = "value"
p.outline_line_color = None

source = ColumnDataSource(data=df)
bar_renderer = p.add_glyph(source, vbar)

def change_data():
    df = pd.DataFrame(data=[['2000', 3, ('2000')], ['2001', 5, ('2001')]],
                      columns=['colors', 'value', 'factors'])

    groups = df['colors'].unique()

    index_cmap = factor_cmap('factors', palette=Spectral6, factors=groups, end=1)
    vbar.fill_color = index_cmap
    source.data = df
    #p.x_range = FactorRange(factors=list(df['factors'].values))
    p.x_range.factors = list(df['factors'].values)

btn = Button(label="Change data")
btn.on_click(change_data)

curdoc().add_root(p)
curdoc().add_root(btn)

Stack traceback and/or browser JavaScript console output

See screenshot below

Screenshots or screencasts of the bug in action

image

@bryevdv
Copy link
Member

bryevdv commented Aug 9, 2019

@harmbuisman It's always preferable to change the smallest thing possible, especially if the alternative is replacing an entire new object (i.e. in this case it is 100% advised to change factors and not make a whole new FactorRange)

There are definitely demonstrations of swapping out one-level factors, but AFAIK you are the very first person to try swapping out two-level factors for one-level factors. Can you see if this problems persists with 3 or 4 factors? It's also possible there is a corner case with only two factors on the axis.

@harmbuisman
Copy link
Contributor Author

@bryevdv

Going from 1 to 2 (by swapping the df= statements) does give an error for me, but a different one:
image

I also get that same error when I go from 3 to 1. To reproduce you can use as the first df assignment:

df = pd.DataFrame(data=[['2000', 1, ('2000', '1', 'a')],['2001',2, ('2001', '2','b')]],
                    columns=['colors', 'value', 'factors'])

Going from 2 to 3 gives that same error.

Going from 3 to 2 does not give an error and works as expected.

4 factors is not accepted by the FactorRange, only 1-3 factors are supported.

I also want to mention the difference in factors type. The 2 and 3 factors type are a list of tuples, but the 1 factor type is an array (as a list of a single tuple is not accepted as input to FactorRange).

@bryevdv
Copy link
Member

bryevdv commented Aug 10, 2019

@harmbuisman sorry I did not mean depth of the factors, I meant more factors, e.g. having 5 two-level then 5 one-level factors.

@harmbuisman
Copy link
Contributor Author

Same problem when using 3 rows.

3 rows in both first situation and second situation, going from 2 factors to 3:

image

from bokeh.plotting import curdoc, figure
import numpy as np
import pandas as pd
from bokeh.models import ColumnDataSource, Button, FactorRange
from bokeh.palettes import Spectral6
from bokeh.transform import factor_cmap
from bokeh.models.glyphs import VBar


df = pd.DataFrame(data=[['2000', 1, ('2000', '1')],
                        ['2001', 2, ('2001', '2')],
                        ['2001', 3, ('2001', '3')]],
                columns=['colors', 'value', 'factors'])

groups = df['colors'].unique()
index_cmap = factor_cmap('factors', palette=Spectral6, factors=groups, end=1)

factor_range = FactorRange(factors=list(df['factors'].values))
p = figure(plot_width=800, plot_height=300, title="Chart",
            x_range=factor_range,
            match_aspect=False, sizing_mode="stretch_width",
            name='chart')

vbar = VBar(x='factors', top='value', width=1,
                    line_color="white", fill_color=index_cmap)

p.y_range.start = 0
p.x_range.range_padding = 0.05
p.xgrid.grid_line_color = None
p.xaxis.axis_label = "value"
p.outline_line_color = None

source = ColumnDataSource(data=df)
bar_renderer = p.add_glyph(source, vbar)

def change_data():

    df = pd.DataFrame(data=[['2000', 1, ('2000', '1', 'a')],
                            ['2001',2, ('2001', '2','b')],
                            ['2001',2, ('2001', '3','c')],
                        ],
                    columns=['colors', 'value', 'factors'])


    groups = df['colors'].unique()

    index_cmap = factor_cmap('factors', palette=Spectral6, factors=groups, end=1)
    vbar.fill_color = index_cmap
    source.data = df
    #p.x_range = FactorRange(factors=list(df['factors'].values))
    p.x_range.factors = list(df['factors'].values)

btn = Button(label="Change data")
btn.on_click(change_data)

curdoc().add_root(p)
curdoc().add_root(btn)

3 rows in both first situation and second situation, going from 2 factors to 1:
image

from bokeh.plotting import curdoc, figure
import numpy as np
import pandas as pd
from bokeh.models import ColumnDataSource, Button, FactorRange
from bokeh.palettes import Spectral6
from bokeh.transform import factor_cmap
from bokeh.models.glyphs import VBar

df = pd.DataFrame(data=[['2000', 1, ('2000', '1')],
                        ['2001',2, ('2001', '2',)],
                        ['2001',2, ('2001', '3')],
                    ],
                columns=['colors', 'value', 'factors'])
                

groups = df['colors'].unique()
index_cmap = factor_cmap('factors', palette=Spectral6, factors=groups, end=1)

factor_range = FactorRange(factors=list(df['factors'].values))
p = figure(plot_width=800, plot_height=300, title="Chart",
            x_range=factor_range,
            match_aspect=False, sizing_mode="stretch_width",
            name='chart')

vbar = VBar(x='factors', top='value', width=1,
                    line_color="white", fill_color=index_cmap)

p.y_range.start = 0
p.x_range.range_padding = 0.05
p.xgrid.grid_line_color = None
p.xaxis.axis_label = "value"
p.outline_line_color = None

source = ColumnDataSource(data=df)
bar_renderer = p.add_glyph(source, vbar)

def change_data():

    df = pd.DataFrame(data=[['2000', 3, '1'], 
                        ['2001', 5, '2'],
                        ['2001', 5, '3']],
                      columns=['colors', 'value', 'factors'])


    groups = df['colors'].unique()

    index_cmap = factor_cmap('factors', palette=Spectral6, factors=groups, end=1)
    vbar.fill_color = index_cmap
    source.data = df
    #p.x_range = FactorRange(factors=list(df['factors'].values))
    p.x_range.factors = list(df['factors'].values)

btn = Button(label="Change data")
btn.on_click(change_data)

curdoc().add_root(p)
curdoc().add_root(btn)

Sign up for free to join this conversation on GitHub. Already have an account? Sign in to comment
Projects
None yet
Development

No branches or pull requests

2 participants